In the world of financial trading, combining technical indicators to optimize investment decisions is a common strategy. Two tools frequently chosen by traders to increase the probability of successful trades are Bollinger Bands and MACD. Bollinger Bands allow traders to observe price volatility, while MACD helps measure the momentum of trends. When used together, they can provide powerful signals, helping traders pinpoint the precise moments to enter and exit the market.

Combining Bollinger Bands with MACD
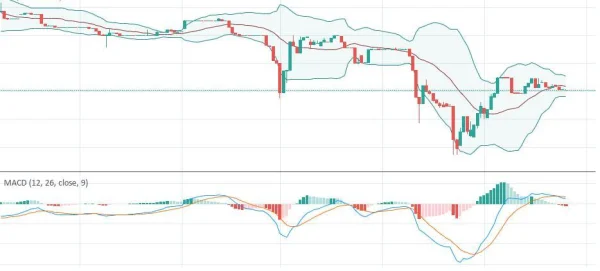
The combination of Bollinger Bands and MACD offers a comprehensive view of market trends and strength. Bollinger Bands help assess volatility, while MACD is a momentum-following indicator that allows traders to identify trend changes. Using both indicators simultaneously not only helps assess the direction of the market but also captures the intensity of the trend.
Breakout Trading with Bollinger Bands and MACD
-
Identify the market trend using MACD
MACD helps you identify the direction of the main trend, which can be combined with Bollinger Bands to search for strong breakout trading opportunities. -
Look for divergences
A divergence between MACD and market price is a strong signal of a potential breakout. This helps traders spot times when the market may change direction. -
Look for entry points when breaking moving averages or trend lines
When price breaks through important support/resistance levels or moving averages (MA), this can signal a breakout. -
Look for confirmation of the breakout point
When Bollinger Bands expand, it indicates increasing volatility, combined with a rise in momentum in MACD, creating a strong signal for a breakout.
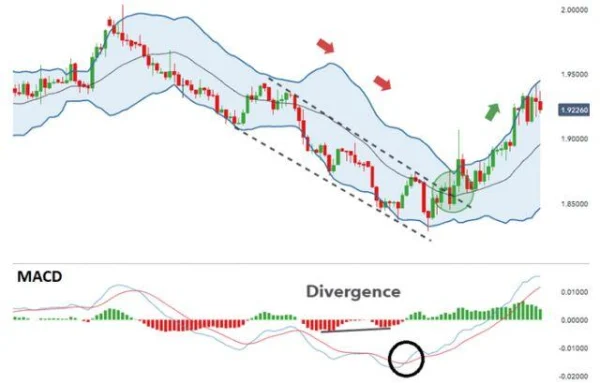
In the GBP/NZD chart below, a strong downtrend is clearly visible. Divergence in the MACD histograms signals that momentum is slowing, allowing traders to trade the breakout.

The break of MA-20, following the divergence, provides a signal to enter a long position. The dotted line on the chart represents the trendline resistance and coincides with the MA-20 of Bollinger Bands. When both levels break, the uptrend is clearly confirmed.
Trading with the Trend, Combining Bollinger Bands and MACD
-
Identify the trend with MACD
MACD helps analyze and confirm the main market trend, which can then guide decisions to trade in the direction of that trend. -
Use bounce points from MA 20 as potential entry points
Bounce points from MA 20 are good signs to enter the market when the trend is expected to remain strong. -
Check MACD to confirm trend continuation
When MACD remains above the signal line and both lines are above 0, it’s a clear sign that the trend is continuing. -
Use Bollinger Bands as stop-loss points
If the trend is bullish, you can set your stop-loss just below the lower Bollinger Band, or conversely, for a bearish trend, place your stop-loss above the upper band.
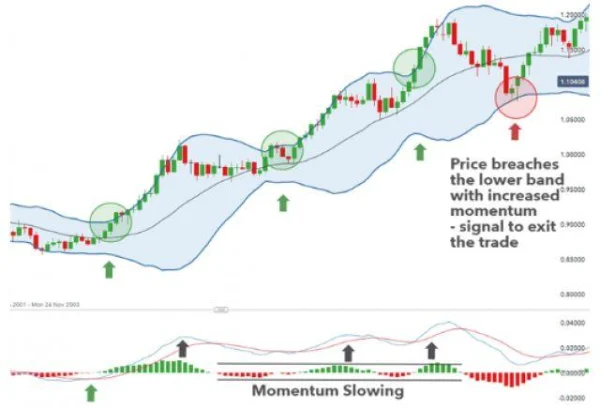
The EUR/USD chart below is a great example of a trend-following strategy using Bollinger Bands and MACD. MACD confirms the uptrend with the MACD line above the signal line and both lines above 0, creating a strong buying trend.

After the strong rise, momentum shows signs of slowing down. However, the trading volume remains low, and no clear reversal is present. When price breaks the MA-20 and creates higher highs, the uptrend continues, reinforcing long positions.
Traders can enter the trade when the Bollinger Bands break or when price remains within a stable upward channel. This confirms the continuation of the trend.
Advantages and Disadvantages of Using Bollinger Bands with MACD
Advantages
Bollinger Bands and MACD can be applied in any financial market and across all timeframes, from short-term to long-term. Bollinger Bands provide highly effective stop-loss levels, such as the lower band for long positions and the upper band for short positions. When combined with MACD, traders can more accurately assess trends and market volatility.
Disadvantages
However, this combination may not be suitable for beginner traders as it requires a deep understanding of how both Bollinger Bands and MACD function. Another downside is that Bollinger Bands work well in range-bound markets, while MACD is a trend-following indicator, which can create conflicting signals if not applied correctly.
Contrasting Views on the Combination of Bollinger Bands and MACD
One of the contrasting views when using Bollinger Bands in combination with MACD is that the MACD indicator can sometimes generate slow signals, especially in fast-moving and volatile markets. MACD is a lagging indicator, meaning that by the time you receive the signal, the trend may have already developed strongly and could be at its peak or about to reverse. In fact, there are times when traders face a “late entry,” meaning by the time the MACD signal appears, the market has already moved too far from the ideal entry price.
For example, in the US stock market in March 2020, when COVID-19 began to have a severe impact, the stock market underwent a sharp decline. During the initial stages of the drop, MACD gave a buy signal as the market started to form small recovery rallies. However, these recoveries were brief, and the market continued to plummet. For traders relying on MACD, these were false signals, leading to significant losses. Bollinger Bands also couldn’t fully identify the market’s reversal during this period, as the bands only indicated volatility, without forecasting the upcoming trend.
An Important Benefit of Combining Bollinger Bands and MACD
Bollinger Bands and MACD can create a perfect combination in stable trending markets, where prices move within a certain range before making a strong breakout. When both indicators provide a consensus signal, the likelihood of successful trades increases significantly.
A typical example in the global stock market is Apple (AAPL) stock in 2019. For traders using the Bollinger Bands and MACD combination strategy, the period in June 2019 presented an ideal opportunity. When Apple’s stock price broke above the upper Bollinger Band, and MACD crossed above the signal line, it was a clear signal for a strong uptrend. After the price continued to rise from 190 USD to nearly 230 USD within three months, traders using this combination were able to maximize profits, thanks to the confirmation from both Bollinger Bands and MACD.
Important Warnings
However, as mentioned earlier, this strategy is not always effective. Bollinger Bands can provide false signals in range-bound or low-volatility markets. In such cases, the Bollinger Bands will often be very tight, and the buy/sell signals generated by MACD may not be accurate. Both indicators may signal a breakout, but not every market breakout immediately leads to a trend continuation.
An example from the Japanese stock market, specifically Sony stock in 2018, illustrates such a situation. In April 2018, Sony’s stock broke above the upper Bollinger Band, and MACD also confirmed an uptrend. However, the stock price later reversed and fell below the initial breakout level. At this point, Bollinger Bands provided a false signal, and MACD did not warn in time of the trend reversal. Traders suffered significant losses because they didn’t understand the possibility of false signals in range-bound market phases.
The Importance of Risk Management
When applying the strategy of combining Bollinger Bands and MACD, one of the most crucial factors is risk management. Even if you can confirm a trend using this combination, knowing when to exit a trade is an essential skill. One piece of advice that DLMvn emphasizes is always using proper stop-loss orders.
For example, in the US stock market in 2022, when technical indicators signaled a “buy” for a stock like Tesla, without a tight stop-loss strategy, traders could have suffered significant losses when the stock price sharply declined again. Especially during unexpected events, such as bad company news or sudden macroeconomic changes, the signals from Bollinger Bands and MACD may lose their accuracy.
Combining Other Indicators to Improve Success Probability
Another important consideration is combining other indicators to enhance the accuracy of the strategy. Bollinger Bands and MACD can be used alongside indicators like RSI (Relative Strength Index) to further confirm market overbought or oversold conditions. This combination can help avoid false signals that Bollinger Bands and MACD alone might miss.
In the global stock market, particularly in major markets like the S&P 500 or Dow Jones, using supplementary indicators like RSI gives traders a more comprehensive view of price movements. For example, in late 2021, when other technical indicators like RSI signaled an overbought condition, using Bollinger Bands and MACD helped traders identify exit points, avoiding a sharp market downturn in January 2022.
Meanwhile, during periods of stable markets, the combination of Bollinger Bands and MACD can provide clear and accurate signals, as long as traders know how to combine them with risk management strategies and recognize market characteristics.

DLMvn > Trading Indicators > Exploring the Relationship Between Bollinger Bands and MACD
Tagged Articles
Discover John Bollinger’s Bollinger Band Rules for Successful Trading
Bollinger Bands
Double Bollinger Bands: Strategy for Predicting Market Volatility
Understanding MACD: The Key to Enhancing Your Investment Strategy
Expand Your Knowledge in This Area
Trading Indicators
Essential Knowledge For Trading With Price Channels
Trading Indicators
Techniques for Using the Pennant Pattern in Stock Market Investing
Trading Indicators
Pivot Points: How to Identify Support and Resistance Levels
Trading Indicators
Trading with Bollinger Bandwidth: Identifying Accurate Entry Points
Trading Indicators
Popular Moving Averages and How to Choose the Best One for Your Strategy
Trading Indicators
What Are Lagging Indicators? A Comprehensive Guide And Practical Applications