Price channels are not just a simple tool in technical analysis but also an ideal companion for traders seeking focus. Unlike complex algorithm-based indicators, price channels are directly derived from price action, faithfully reflecting the interplay between market supply and demand. With this approach, you can easily identify key price zones and predict market behavior within a clearly defined range.
Common Types of Price Channels
Depending on trading purposes and styles, price channels are categorized into various types:
- Linear regression channels: Calculated using statistical methods, suitable for analyzing historical data.
- MA-based price channels: Derived from moving averages, often used in prolonged trends.
- Trendline price channels: Based on manually drawn trendlines, offering high flexibility and adaptability across different markets.
Whichever type of channel you prefer, the most important thing is understanding how to use them effectively. DLMvn will guide you through four popular methods to maximize their utility in trading.
Trend Following
In a strong trending market, price channels are indispensable tools for identifying pullback points – ideal moments to join the ongoing trend. The perfect condition is for the price channel to have a moderate slope: steep enough to avoid noise but not too flat to create ambiguity.
1. Confirm Market Trends
A steadily upward-sloping price channel indicates a sustainable uptrend, and vice versa. Use this to filter out noise from sideways markets.
2. Identify Pullback Points
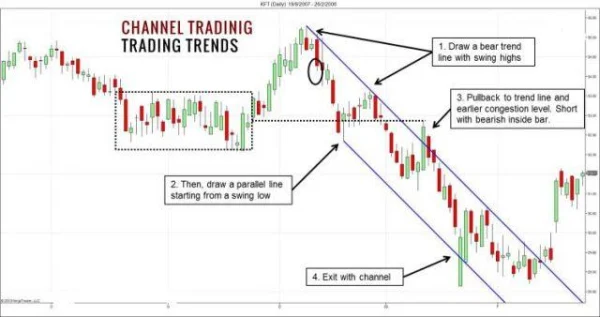
For a downward-sloping channel, draw a trendline connecting the main highs. Then, draw a parallel line through the nearest low to complete the channel. When the price nears the upper trendline, this is an ideal pullback point for a sell order.
For instance, during FPT’s growth phase from 2020-2021, the stock formed several perfect pullbacks. Investors could leverage the upward-sloping trendline to enter buy positions at pullback points. In this case, the price channel not only indicated the trend but also provided reasonable price targets.
Consider the following example: With two consecutive highs, draw a downward-sloping trendline. Then, to complete the price channel, draw a parallel line starting from the nearest low. The price subsequently rises to test the trendline, serving as resistance. Moreover, this trendline test aligns with a resistance zone created by a prior sideways area. This setup offers an excellent shorting opportunity. A bearish inside bar pattern serves as confirmation for an ideal sell point. Here, the price channel provides a perfect price target for the continuation trade. Additionally, the lower channel line serves as an exit point – a clear profit target for this trade.

Always aim to take profits near the opposite channel line. This helps you avoid unexpected reversals that could cause unnecessary losses.
Reversal Trading
One of the greatest advantages of price channels is their ability to signal trend exhaustion. When the price moves beyond a channel’s boundary, it can indicate that the buyers (or sellers) are losing momentum.
1. Channel Width and Trend
The width of a channel often reflects market volatility. When the price breaches the channel, it’s time to consider a potential reversal. However, to avoid false signals, prioritize channels that counter the main trend.
2. Candle Confirmation Signals
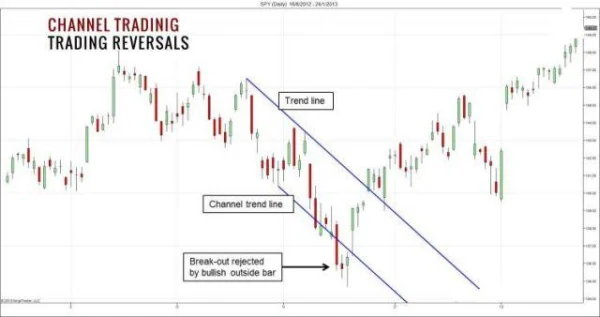
After a breakout, look for clear candlestick patterns to confirm market rejection. A pinbar or engulfing bar is highly reliable in such cases.
For example, during VCB’s correction phase at the end of 2019, the stock formed a downward-sloping price channel. When the price broke below the lower boundary and formed a pinbar with a long lower wick, this was a golden opportunity for a reversal buy trade.

In reversal trading, focus on channels with steep slopes. Steep channels often provide stronger signals and make price rejection points easier to identify.
Sideways Trading
Price channels are not only effective for trending markets but also a powerful tool for identifying sideways phases. In a range-bound market, the most common strategy is to utilize channel boundaries: sell when the price touches the upper channel and buy near the lower boundary. A famous example is the Gimmee Bar strategy, which uses indicators like Bollinger Bands instead of relying solely on trendlines.
Bollinger Bands consist of a central MA line and two boundaries reflecting the standard deviation of price action, helping you identify market volatility and behavior.
1. Identifying a Sideways Market
One key sign of sideways movement is when the price starts oscillating within a tight range after a period of high volatility. Observe the expansion of Bollinger Bands during this phase. When the candles begin to shrink, it’s often a signal that the market is entering a consolidation phase.
2. Selling at the Upper Band
At the upper Bollinger Band, reversal candlestick patterns often signal a potential sell opportunity. Compare the current price behavior with previous rallies to identify buyer exhaustion.
For instance, when a rejection candle with a long upper wick forms near the upper band, it suggests selling pressure has emerged.
3. Buying at the Lower Band
At the lower band, a pinbar bouncing off a support zone is an ideal signal to open a buy position. These price rebounds often result from strong market support.
Although this strategy offers numerous trading opportunities, not all signals are accurate. By managing risk effectively and setting reasonable profit targets, using Bollinger Bands in sideways markets can still yield positive results.
When trading in sideways markets, exit your trade near the opposite band to avoid unexpected reversals or breakouts.
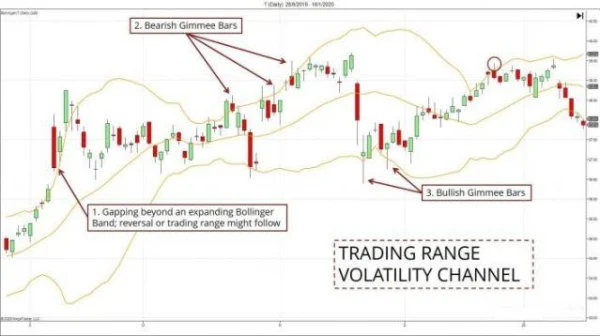
The chart below illustrates a sideways phase following a sharp rally:

- Here, identifying the beginning of a sideways market is crucial. One way to do this is by observing strong price movements beyond expanding Bollinger Bands. This marks unsustainable momentum, making a reversal or sideways phase more likely.
- A sell signal forms when a reversal candlestick pattern coincides with the upper band. Observe how the price rejects further increases and compare it to prior rallies. Clearly, market behavior has shifted.
- Next, look for buy signals. Bullish reversal pinbars bouncing off the lower band’s support are excellent entry points, aren’t they?
Trading Breakout
The strategies mentioned earlier are based on the assumption that prices will stay within the channel. However, when this assumption no longer holds, it’s time to capitalize on breakout opportunities—moments when the market breaks through the channel boundaries to transition into a new trend.
1. Breakout Approach with Bollinger Bands
Bollinger Bands are not only effective in sideway markets but also powerful tools for identifying breakout points. The basic rules are as follows:
-
Bullish Breakout:
Wait for a bullish candle to close above the upper band. Then, place a buy stop order just above the high of the breakout candle. If the next candle does not trigger the order, cancel the trade. -
Bearish Breakout:
Wait for a bearish candle to close below the lower band. A sell stop order is placed just below the low of the breakout candle and only kept if the next candle activates the order.
2. Practice Through Examples
Here are some common scenarios:
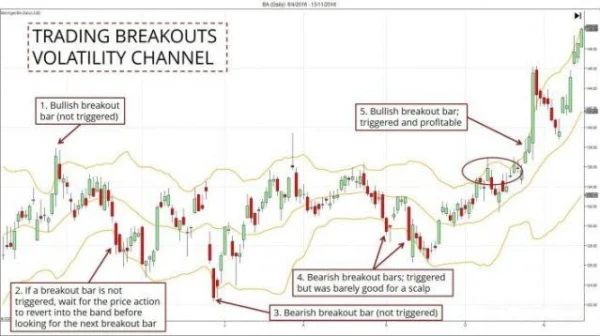
- A bullish breakout candle appears strong but fails to trigger further upward momentum. This is a false breakout where waiting for confirmation prevents a losing trade.
- Two bearish candles close below the lower band, but only the first one is considered. When it fails to activate the sell stop order, the trade is disregarded.
- A strong bearish candle does not trigger the order, avoiding an inefficient entry point.
Finally, a valid bullish breakout candle initiates a new upward trend. These situations highlight the importance of thoroughly confirming before trading.

False breakouts are unavoidable. Always use stop-loss orders to protect your capital, and only pursue breakouts with clear confirmation from price action.
Challenges When Trading with Price Channels
Although price channels are intuitive tools, they are not always easy to apply in practice. Market irregularities, unexpected news, or “noise” can distort signals.
1. Lack of Patience
Many traders overlook the fundamental rule of waiting for price to retest trendlines before making a decision. This often leads to premature entries or late exits.
2. Choosing the Wrong Channel
Different market conditions require different types of price channels. For instance, a linear regression channel may work well in trending markets, while an MA-based channel is more effective in sideway phases.
3. Risk Management
When trading with price channels, you must predefine clear stop-loss and take-profit levels. Otherwise, unexpected price movements can result in significant losses.

DLMvn > Trading Indicators > Essential Knowledge For Trading With Price Channels
Expand Your Knowledge in This Area
Trading Indicators
Trade Smarter with the Double Top Chart Pattern
Trading Indicators
Key Continuation Price Patterns Every Investor Should Know
Trading Indicators
Three Inside & Outside Up Candlestick Patterns: Bullish Reversal Signals
Trading Indicators
Simple Trading Strategy with Support and Resistance
Trading Indicators
How to Identify Trendlines in Trading
Trading Indicators
“Trend is Your Friend” – How to Identify a Strong Trend in the Stock Market