TABLE OF CONTENTS
- Overbought and Oversold Zones
- RSI Indicator
- Reliability of Overbought and Oversold Signals?
- Supporting Tools for Overbought and Oversold Signals
- Contrasting Perspectives on Overbought and Oversold Phenomena
- In-Depth Analysis: Why Can Overbought and Oversold Conditions Persist?
- Risks of Overrelying on RSI
- Supplementary Tools to Enhance Effectiveness
- Final Thoughts
Overbought and Oversold Zones
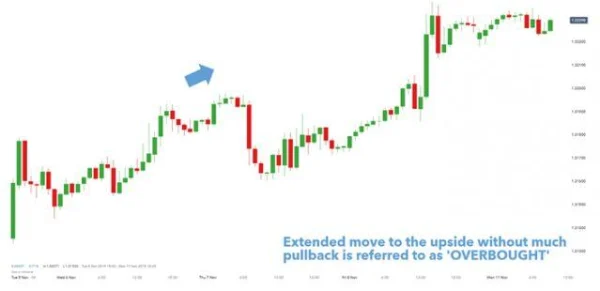
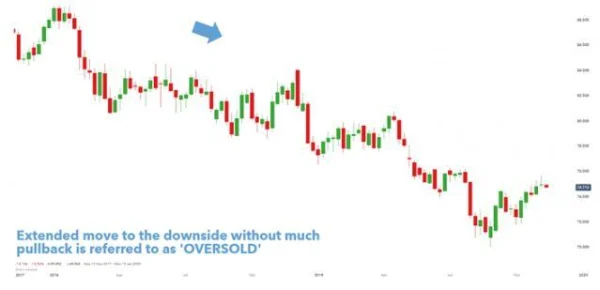
The overbought phenomenon occurs when the price of an asset has risen significantly over a period without any substantial pullbacks. Conversely, oversold refers to a situation where the price has dropped sharply without notable recoveries.
Imagine a market scenario: if prices climb continuously like a train rushing uphill without pausing, this will inevitably end with a price correction to restore balance. Similarly, prolonged price declines result in an opposite reaction. This is when the concept of trend reversal becomes crucial for investors.


Overbought and oversold zones are often associated with a higher likelihood of price reversals. However, these phenomena do not always occur immediately. Investors need to use additional technical analysis tools to confirm signals rather than relying solely on intuition.
RSI Indicator
One of the most popular tools for identifying overbought or oversold conditions is the Relative Strength Index (RSI).
1. How to Use RSI
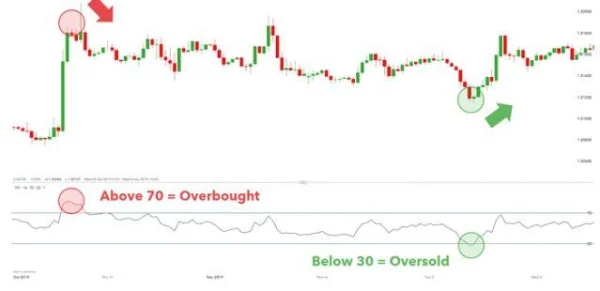
RSI operates on a scale from 0 to 100:
- When RSI exceeds 70, the market may be in an overbought condition, signaling a potential downward reversal.
- When RSI falls below 30, the market is considered oversold, with a possible upward rebound.
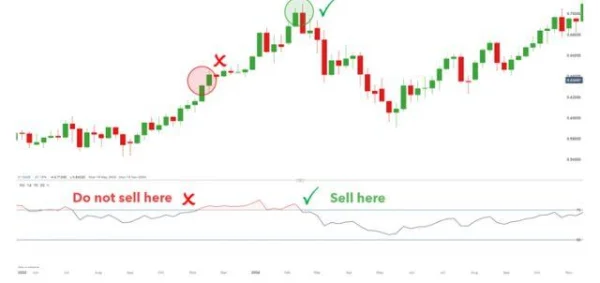
However, RSI does not always provide instant signals. In some cases, RSI can remain in overbought or oversold zones for an extended period before the price direction changes.

As seen in the chart above, an experienced investor would not rush to sell when RSI exceeds 70 but wait for additional confirmation signals, such as RSI returning below 70. This approach enhances success rates and optimizes entry points.

2. Common Mistakes
A frequent mistake is trying to “catch the top” or “catch the bottom” when RSI moves deep into overbought or oversold zones. This can lead to losses if the price continues its current trend.
“Patience is always key when using RSI. Wait for clearer signals before executing trades.”
Reliability of Overbought and Oversold Signals?
Relying solely on overbought or oversold signals is often insufficient. They must be combined with other factors such as trends, risk management, and market sentiment to create a more comprehensive analysis.
Think of it like building a house. A builder cannot rely on just a hammer to complete the project; they need saws, drills, and various tools. Similarly, trading requires multiple supporting tools to ensure accuracy.
Supporting Tools for Overbought and Oversold Signals
1. Identifying Trends
Determining the current trend is the first step to choosing the right timing. In an uptrend, oversold signals are more significant; in a downtrend, overbought signals carry more weight.
2. Risk Management
Applying appropriate risk-reward ratios is indispensable. A successful trade depends not only on a good entry point but also on effective risk control.
3. Market Sentiment
Market sentiment can be measured through tools like the Sentiment Index or Commitment of Traders (COT) reports. These data points help investors better understand the market context and enhance signal analysis accuracy.
Combining RSI with moving averages (MA) to identify trends before making decisions has significantly helped DLMvn minimize risks in long-term trades.”
Contrasting Perspectives on Overbought and Oversold Phenomena
Many investors believe that overbought and oversold conditions are crucial indicators for identifying reversal points. However, opposing views exist, particularly among trend-following investors. They argue that focusing on reversal signals may cause investors to miss significant opportunities during strong trends.
Consider an example: The S&P 500 index in 2020 experienced a strong upward trend following the pandemic-induced decline. During this period, RSI frequently exceeded 70, signaling overbought conditions. Yet, instead of correcting, the market continued to rise due to optimistic sentiment and financial support from the U.S. Federal Reserve (FED). Relying solely on overbought signals to sell might have caused investors to miss substantial profits.
RSI exceeding 70 does not always indicate an imminent market decline. Understanding the broader context, such as market sentiment and fundamental factors, is essential.
In-Depth Analysis: Why Can Overbought and Oversold Conditions Persist?
Prolonged overbought and oversold signals are not uncommon in financial markets. These situations often occur when markets are heavily influenced by external factors, such as monetary policy or major news events.
A notable example is Tesla (TSLA) stock during 2020-2021. As Tesla achieved significant milestones in sales and joined the S&P 500 index, its stock price surged, pushing RSI into overbought territory for an extended period. However, investor expectations and index fund buying momentum drove prices higher without significant corrections.
This phenomenon demonstrates that overbought or oversold signals do not always lead to immediate reversals. In such cases, additional factors are needed to reassess the situation.
Risks of Overrelying on RSI
A common mistake is treating RSI as an “absolute” tool. In reality, RSI signals can be misleading, especially in volatile markets or during unexpected events.
For instance, recall the Lehman Brothers collapse in 2008. Before the event, RSI for many stocks and major indices indicated oversold conditions, raising expectations of a rebound. However, when the crisis unfolded, markets continued to plummet, causing significant losses for investors relying on RSI alone.
RSI is a useful tool but should be integrated into a broader analytical system rather than forming the sole basis for a strategy.
Supplementary Tools to Enhance Effectiveness
Beyond identifying trends and market sentiment, additional tools can complement RSI to improve the accuracy of overbought and oversold signals:
1. Fibonacci Retracement
Fibonacci Retracement is a valuable tool for identifying support and resistance levels, especially when combined with RSI. For instance, if RSI signals oversold conditions while the price approaches the 38.2% or 50% retracement levels, the likelihood of a bounce increases.
2. Bollinger Bands
Bollinger Bands are an effective indicator for confirming RSI signals. When RSI indicates overbought conditions and the price also exceeds the upper Bollinger Band, the probability of a downward correction becomes more apparent.
3. Trading Volume
Trading volume plays a crucial role in validating RSI signals. When RSI suggests overbought or oversold conditions, but volume is low, the signal may lack strength to predict a reversal.
Combining RSI with Bollinger Bands and volume analysis helps filter noise and identify genuinely reliable signals.
Final Thoughts
Although RSI is a powerful tool for identifying overbought and oversold conditions, using it in isolation carries inherent risks. It is vital to recognize that no single tool is perfect. Success in investing depends on combining analytical methods with patience and real-world experience.

DLMvn > Trading Indicators > Decoding Overbought and Oversold Phenomena: What Do They Mean?
Expand Your Knowledge in This Area
Trading Indicators
4 Ways to Leverage Support and Resistance for Optimal Trading
Trading Indicators
Increase Your Trading Opportunities with Bullish Hammer Candlestick
Trading Indicators
Head And Shoulders Pattern: How To Identify Reversal Signals
Trading Indicators
Double Bollinger Bands: Strategy for Predicting Market Volatility
Trading Indicators
Essential Knowledge for Interpreting Divergence Signals
Trading Indicators
Trade Smarter with the Double Top Chart Pattern