The Doji candle pattern is a significant component in the candlestick charting repertoire, encompassing five distinct variations. While the Standard Doji symbolizes market indecision, the other variants narrate unique stories that can influence traders’ strategies and decisions.
The Importance of Doji Candlestick Patterns
Doji candles signal market indecision or potential trend reversals. They are popular and widely utilized in trading because they are among the easiest patterns to identify. The shadows of the Doji candles offer valuable guidance regarding potential stop-loss levels that traders might consider.
This article will delve into the formation of Doji candle patterns and outline the five most potent and commonly traded Doji variants:
- Standard Doji
- Long-Legged Doji
- Dragonfly Doji
- Gravestone Doji
- 4-Price Doji
How Doji Candle Patterns Are Formed
A Doji candle is formed when the opening and closing prices of a stock are approximately equal during the timeframe in which the Doji appears. Although the price may fluctuate between the open and close, the fact that they are nearly identical indicates that the market is struggling to decide whether to push prices higher or lower.
Traders should remember that high-probability trades align with long-term trends. When a Doji appears at the bottom of a retracement in a bullish trend or at the top of a pullback in a bearish trend, traders should consider entering trades in the direction of the prevailing trend. In a bullish trend, stop-loss levels should be placed below the lower shadow of the Doji, while in a bearish trend, stop-loss levels should be positioned above the upper shadow.
The Top 5 Doji Candle Patterns
1. Standard Doji
The Standard Doji is a single candle that does not carry much standalone significance. To understand the implications of this candle, traders should observe the price action preceding its formation.
For example, in a bullish trend, a Standard Doji can confirm the continuation of that trend. However, the chart below illustrates a reversal of a bullish trend, highlighting the importance of validation after the Doji appears.
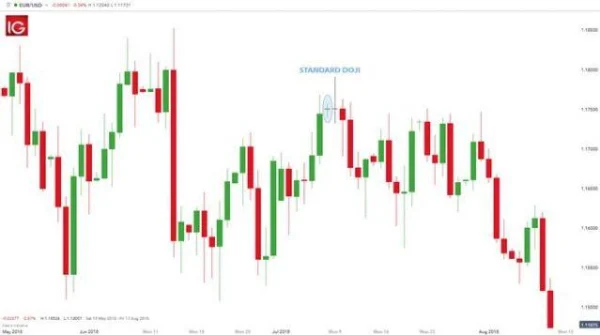
Chart Example: Standard Doji
2. Long-Legged Doji
The Long-Legged Doji is characterized by extended shadows on both the top and bottom. This signifies that during the price action timeframe, there was considerable movement up and down, but the closing price was nearly the same as the opening price. This pattern reflects indecision among buyers and sellers.
At the point where the Long-Legged Doji appears, as shown in the chart below, it becomes apparent that the price has recovered slightly after a significant downward move. If the Doji appears at the top of a pullback, traders might interpret the indecision as a potential reversal signal and look to sell the stock upon the opening of the next candle, placing a stop-loss at the top of the Long-Legged Doji.
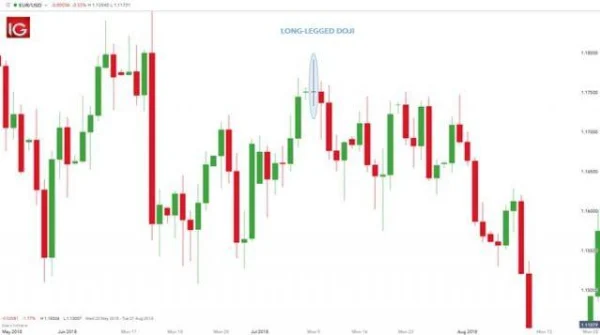
Chart Example: Long-Legged Doji
3. Dragonfly Doji
The Dragonfly Doji can occur at the top of a bullish trend or at the bottom of a bearish trend, signaling a potential trend reversal. This pattern has no upper shadow, forming a “T” shape, indicating that the price did not move above the opening price. The long lower shadow suggests a rejection of lower prices. When this Doji appears at the bottom of a downtrend, it signals a strong bullish reversal.
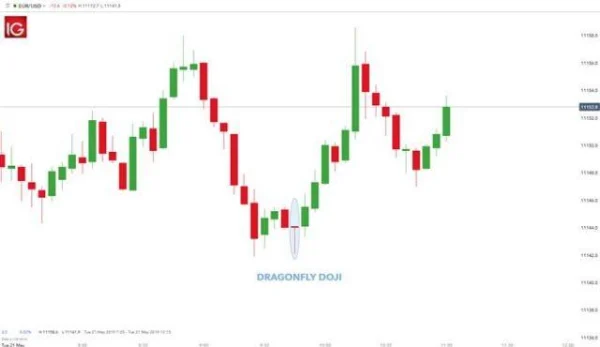
Chart Example: Dragonfly Doji
4. Gravestone Doji
The Gravestone Doji is the opposite of the Dragonfly Doji. It appears with the opening and closing prices at the lower end of the trading range. After opening, buyers may have pushed the price higher, but by the end of the session, they were unable to sustain that upward momentum. When this candle appears at the peak of a price rally, it indicates a bearish signal.
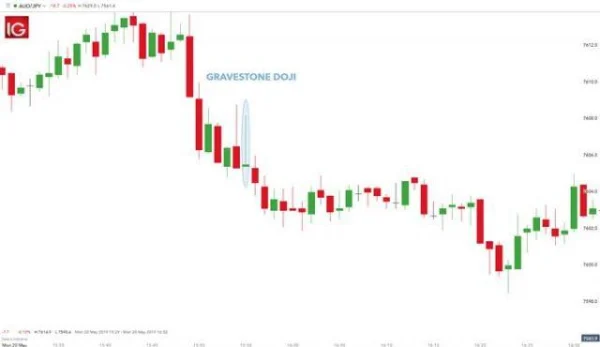
Chart Example: Gravestone Doji
5. 4-Price Doji
The 4-Price Doji is simply a horizontal line with no upper or lower shadows. This pattern signifies ultimate indecision, as the high, low, opening, and closing prices are all equal. The 4-Price Doji is a unique model that once again demonstrates indecision or an extremely quiet market.
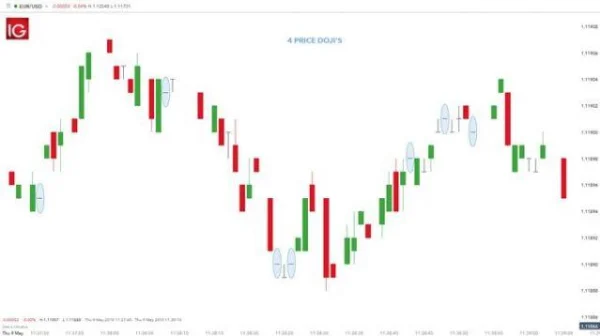
Chart Example: 4-Price Doji
Using Doji Candlestick Patterns in Conjunction with Other Indicators
To maximize effectiveness in trading, you can combine Doji candlestick patterns with other technical indicators to gain clearer insight into trends and improve decision accuracy. Here’s how Doji can be paired with some popular indicators.
Moving Averages (MA)
Moving averages help identify long-term trends and potential support or resistance levels. When a Doji appears near or touches a key moving average (like the MA50 or MA200), this could signal a reversal:
- In an uptrend: If a Doji forms around the MA50 or MA200, it might indicate a continuation of the trend after a brief pullback. Seeing a Doji here could prompt consideration of buying if prices rebound from the MA line.
- In a downtrend: If a Doji forms below the MA200, it may suggest the downtrend is likely to persist.
Relative Strength Index (RSI)
RSI reveals whether the market is in an overbought or oversold state:
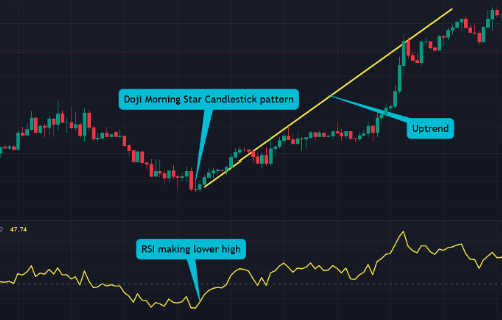
- If RSI is above 70 (indicating overbought conditions) and a Doji forms at the trend peak, this signals that the market might reverse downward. In this case, you could consider selling when the Doji appears.
- If RSI falls below 30 (indicating oversold conditions) and a Doji forms at the trend bottom, it may hint at a rebound upward. However, it’s wise to wait for a confirmation signal before initiating a buy order.
Real-World Example: A market study shows that 60% of successful trades occur when Doji forms in an overbought or oversold zone in RSI, owing to its capability in predicting reversal points more precisely.
Moving Average Convergence Divergence (MACD)
MACD is a trend indicator, particularly useful in gauging market momentum:
- When MACD crosses above the signal line, and a Doji appears within an uptrend, this could signal a continuation of the upward trend.
- When MACD crosses below the signal line, combined with a Doji in a downtrend, it indicates that the downtrend may continue, suggesting a potential sell opportunity.
Bollinger Bands
Bollinger Bands reveal price volatility and identify overbought or oversold zones in the market:
- When prices reach the upper band of Bollinger and a Doji appears, this might indicate a reversal downwards as the market enters an overbought zone.
- When prices hit the lower band and a Doji forms, it could be a potential sign of a rebound upwards.
Practical Insight: Studies indicate that 55% of Doji signals near the upper or lower Bollinger Bands lead to opposite price movements. Using Bollinger Bands in this way helps traders pinpoint more accurate entry/exit points.
Volume
Trading volume plays a key role in validating Doji signals:
- If a Doji appears with high volume, this indicates strong indecision and increases the likelihood of a significant reversal. High volume can often suggest the beginning of a new trend.
- If Doji appears with low volume, the market might simply be pausing. In this case, the Doji doesn’t provide a strong trend signal and may lack clear meaning.
CONCLUSION
Understanding the different Doji candle patterns will empower traders to apply this knowledge effectively when trading Doji candles. Reading candlestick charts is a fundamental skill necessary before analyzing more complex techniques, such as Doji patterns. By integrating these insights into their trading strategies, investors can make more informed decisions in the ever-evolving financial markets.

DLMvn > Trading Indicators > An Introduction to the 5 Doji Candle Patterns
Tagged Articles
5 Variations of the Doji Star Candlestick Pattern
Profiting from the Morning Doji Star Candlestick Pattern
Expand Your Knowledge in This Area
Trading Indicators
Discover John Bollinger’s Bollinger Band Rules for Successful Trading
Trading Indicators
Exploring the Relationship Between Bollinger Bands and MACD
Trading Indicators
Pitchfork and Its Key Benefits in Trading
Trading Indicators
Simple Trading Strategy with Support and Resistance
GlossaryTrading Indicators
Stochastic Oscillator: An Effective Tool For Forecasting Market Trends
GlossaryTrading Indicators
Moving Averages – A Comprehensive Overview