Skip to content
Glossary Of Financial Terms
Trading Indicators
Glossary
See more
Glossary
Against Actual: A Unique Trading Strategy in the Commodity Market
Glossary
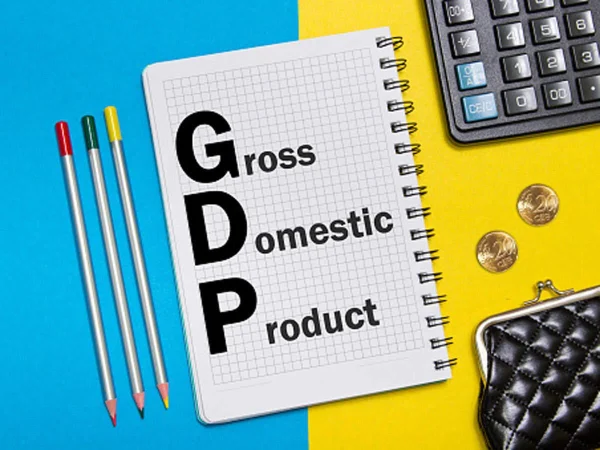
GDP and Economic Growth
Glossary
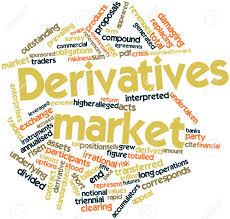
Financial Derivative Instruments: Understanding Them for Effective Investment
Glossary
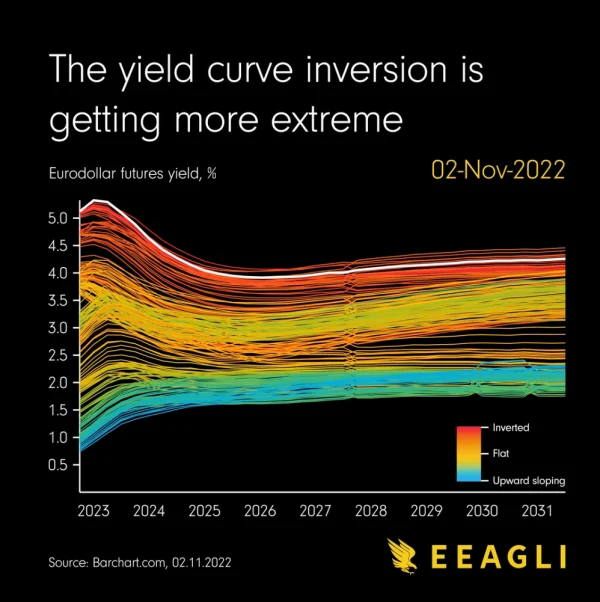
What Is An Inverted Yield Curve?
Glossary
The Federal Reserve (FED), Monetary Policy, and the Stock Market
Glossary
US Dollar Index – Understanding USDX and Its Role in the Market
Glossary
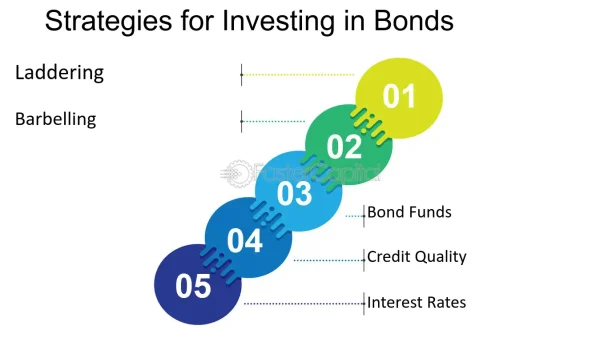
Bonds: A Comprehensive Guide for New Investors
Glossary
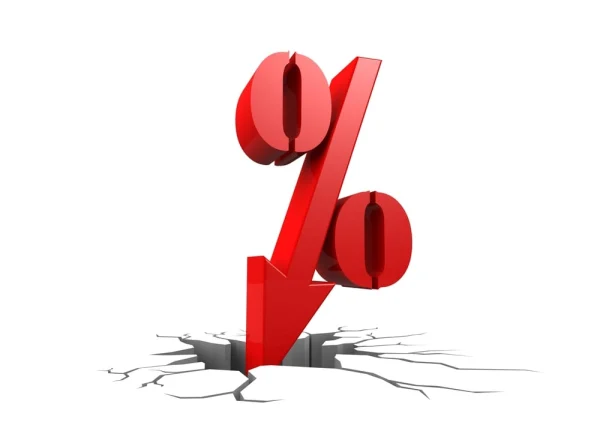
What is Negative Interest Rate?
Glossary
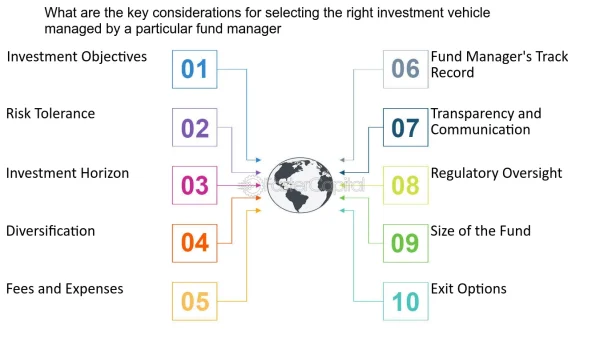
What are Fund Certificates? Key Considerations for Effective Investment
Trading Indicators
See more
Trading Indicators
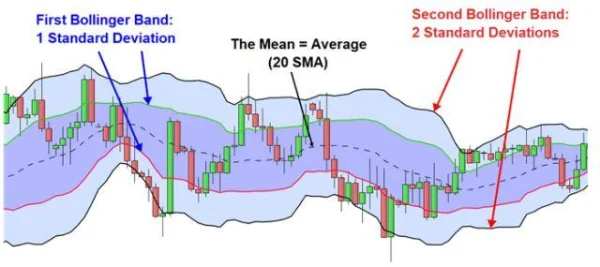
Double Bollinger Bands: Strategy for Predicting Market Volatility
Trading Indicators
10 Candlestick Patterns Every Trader Should Know
Trading Indicators
Trade Smarter with the Double Top Chart Pattern
Trading Indicators
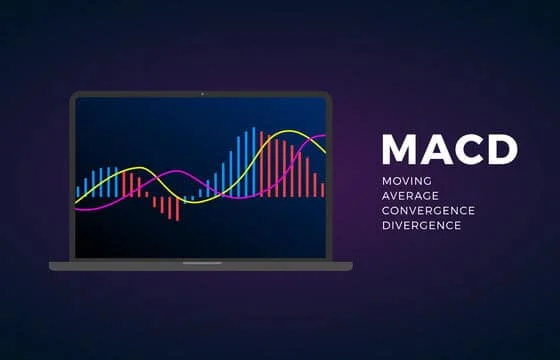
Understanding MACD: The Key to Enhancing Your Investment Strategy
Trading Indicators
Essential Knowledge For Trading With Price Channels
Trading Indicators
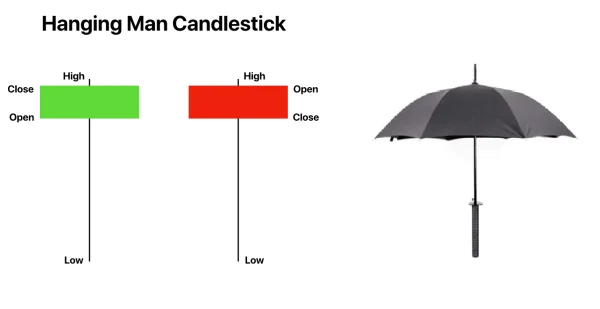
Hanging Man: A Reversal Candlestick Pattern
Trading Indicators
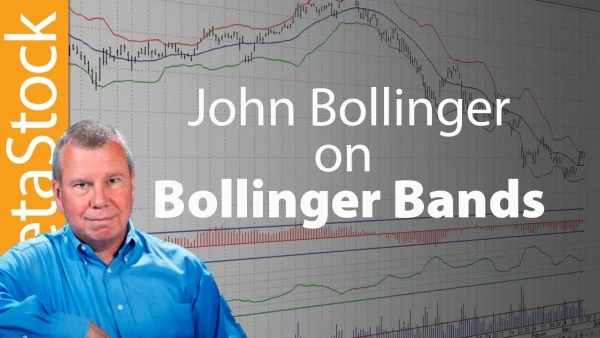
Discover John Bollinger’s Bollinger Band Rules for Successful Trading
Trading Indicators
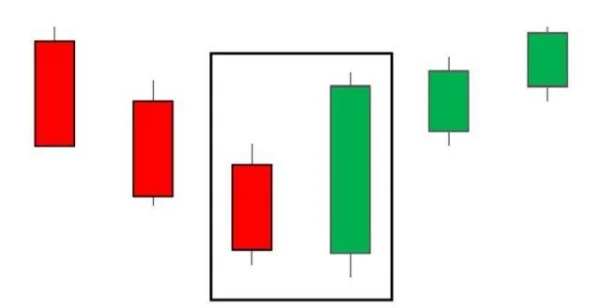
Engulfing Pattern: A Reversal Signal in Technical Analysis
Trading Indicators
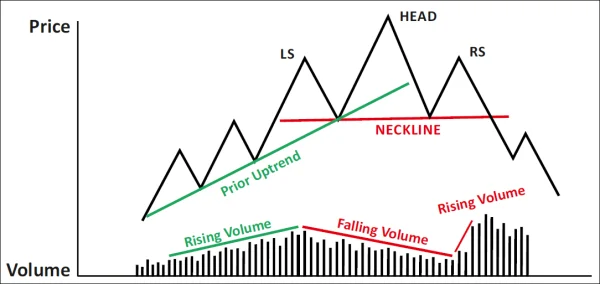
Head And Shoulders Pattern: How To Identify Reversal Signals
Glossary Of Financial Terms
Trading Indicators