TABLE OF CONTENTS
- Characteristics of Price Action
- The Important Role of Support and Resistance Levels
- Important Chart Patterns
- The Spirit of Trend Following Trading
- The Challenges of Trading with Price Action
- In-Depth Analysis of Price Action and Contrasting Views
- Challenges in Trading with Price Action
- Optimistic and Pessimistic Views on Price Action
Reading price action is both an art and a science of trading, based on the interaction between buyers and sellers reflected through price movements on the chart. It is a method that does not rely on complex technical indicators but focuses on the true value of the market, offering a direct and clear approach to making trading decisions.
Characteristics of Price Action
Price action can be described as a combination of art and science because it helps traders understand the psychology and motivations of investors through price fluctuations. Traders who follow this approach often eliminate technical indicators and instead focus solely on price and its movements to make decisions.
This method follows a fundamental principle: “Price is everything.” This means that the price reflects all the information in the market, including economic factors, investor psychology, and events affecting the stock. Therefore, price action provides a deep insight into what is actually happening in the market, ignoring external factors such as indicators and focusing on a single element: price.
The Important Role of Support and Resistance Levels
One of the most important elements in reading price action is support and resistance levels. These are price points where buyers or sellers can strongly intervene in the market, changing the direction of the price. When price approaches support levels, the likelihood of an increase in price is higher, and when it nears resistance, a reversal may occur.

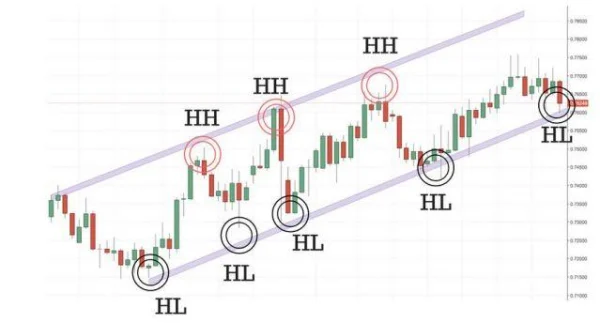
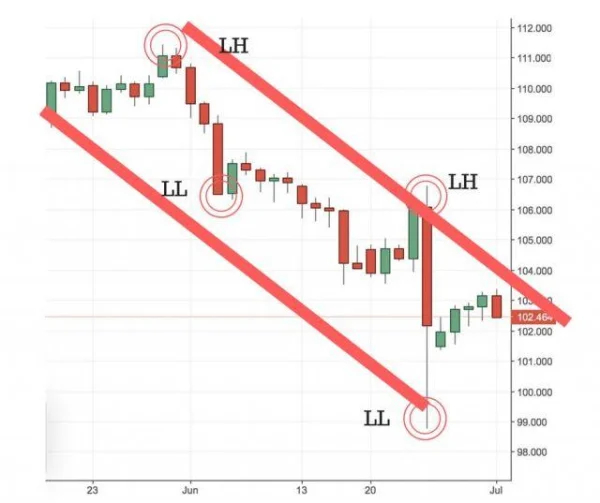
Looking at the chart of a stock in an uptrend, you will see the price forming higher highs and higher lows. This confirms the uptrend, as buyers continue to push the price higher. Conversely, in a downtrend, you will see lower highs and lower lows, signaling that sellers are in control.


Important Chart Patterns
Price action is not just about analyzing support or resistance levels, but also about recognizing chart patterns. These patterns are important signals that help traders predict the next price move.
Chart patterns can show breakouts, reversals, or trend continuations. For example, if you see a “double top” pattern in an uptrend, this could signal a reversal, and the price might fall.

Price action can be read on all timeframes, from minute charts for day traders to monthly charts for long-term traders. No matter who you are, you need to familiarize yourself with and practice these patterns to enhance your trading skills.
The Spirit of Trend Following Trading
A popular trading method used by many trend-following traders that relies solely on price action is “breakout” trading – buying when the price surpasses the highest point of the last 20 days and selling when the price creates a new low within 10 days. This method allows you to capitalize on significant market moves while keeping risk under control.
One legendary trader who achieved significant success using this method was Nicolas Darvas. He was one of the first to apply price action to make millions of dollars in stock trading. Darvas looked for stocks that made new highs with increasing volume. He created the “Darvas Box” to identify support and resistance areas, then found entry points when the price broke out above the box’s high, and sold when the price broke below the box’s low.

This system helped Darvas monitor and hold his positions as long as the price remained within the box, while also protecting his trades with a stop-loss if the price broke below. This is how he sought big opportunities, with large profits and controlled risk.
“Stick to your principles, only trade when there is a clear breakout, and you will find that the market is a long-term companion.” – Nicolas Darvas
The Challenges of Trading with Price Action
Although it sounds appealing, this method is not without challenges. One of the major issues is correctly identifying chart patterns across different timeframes. Signals from price action can sometimes be ambiguous and unclear, causing traders to “lose their way.”
Moreover, assessing support and resistance levels is not always accurate. The market is constantly changing, and these price levels don’t always hold. This creates a significant challenge for those new to this method.
Furthermore, trading based on price requires a cool head and strong emotional control. Without the support of indicators, traders must fully trust their decisions, and sometimes, this can be very difficult when facing strong market fluctuations.
In-Depth Analysis of Price Action and Contrasting Views
Price action is a popular trading method, however, in the financial world, it is not without its contrasting opinions. Some believe that price action is the only way to succeed in trading, while others argue that this method can have significant limitations, especially when compared to other approaches like fundamental analysis or strategies using technical indicators.
One of the reasons why price action receives much praise is its simplicity. Unlike complex strategies that require the use of numerous indicators, price action relies solely on price and its behavior on the chart, helping traders avoid “information overload.” However, this simplicity can also lead to some major issues, especially in volatile markets.
Technical Indicators: A Contrasting Approach
Many traders believe that using technical indicators like RSI, MACD, or Bollinger Bands provides them with a clearer view of market trends and entry/exit points. Some argue that price action may not provide enough information, as price does not always fully reflect the underlying fundamentals or market psychology.
One advantage of using technical indicators is their ability to provide more accurate signals for identifying reversals or confirming trends. For example, RSI above 70 may indicate an overbought market, while RSI below 30 may signal an oversold market, helping traders spot potential trading opportunities. However, in many cases, over-reliance on technical indicators can cause traders to miss out on great opportunities that can only be recognized through reading price action on the chart.
An experienced trader once said: “Technical indicators can help confirm your decision, but they cannot replace intuition and the ability to read price action in a rapidly changing market.”
Concrete Example of Price Action in the Global Stock Market
Let’s look at a real-world example from the US stock market to better understand how price action can influence trading decisions.
At the end of 2018, when the US stock market experienced a sharp decline, the S&P 500 lost about 20% of its value in less than three months. However, for traders who mastered the price action method, they could spot signs of an upcoming reversal. Even though technical indicators like RSI and MACD remained at extreme levels, price action showed a solid price pattern at key support levels.
A notable example is the stock of Amazon (AMZN) during that sharp price drop. When Amazon’s price fell below an important support level, those following price action would notice a “pin bar” pattern (a type of reversal candle) appearing shortly after. This candlestick pattern might signal that the selling pressure had exhausted, and a reversal upward was imminent. As a result, Amazon’s price quickly rebounded, providing significant profits for those traders who could read price action accurately.
Challenges in Trading with Price Action
One of the biggest challenges when applying the price action method is the ability to accurately analyze patterns and price levels. In the stock market, not all chart patterns are clear or predictable. For example, “head and shoulders” or “double top” patterns don’t always indicate a strong reversal, and they can be broken in certain market conditions.
Additionally, identifying support and resistance levels can be difficult, especially when the market is highly volatile and unstable. Inexperienced traders often make mistakes in identifying these key price levels, leading to poor trading decisions.
Another challenge is the psychological aspect. Trading with price action requires complete focus on price movement and patience to wait for clear signals. However, many traders lack patience, which causes them to make hasty decisions and become influenced by emotions.
Optimistic and Pessimistic Views on Price Action
Some people will always believe that price action is the shortest and most effective path to success in the stock market. They argue that price reflects all market factors, and by understanding how this method works, you can find profitable opportunities in any situation. However, this is not always the case.
While price action provides strong signals, chart patterns cannot guarantee absolute accuracy. The stock market is a “high-risk” environment full of volatility. No strategy is perfect, and applying price action is no guarantee of success.

DLMvn > Trading Indicators > What Is Price Action? A Basic Guide to Understanding This Method
Tagged Articles
Price Action vs Indicators – Which One Suits Your Trading Style?
Expand Your Knowledge in This Area
GlossaryTrading Indicators
Moving Averages – A Comprehensive Overview
Trading Indicators
Technical Analysis Indicators Groups: Understanding Their Differences and Applications
Trading Indicators
An Introduction to the 5 Doji Candle Patterns
Trading Indicators
Streamlining Strategies: Mastering RSI to Maximize Profits
Trading Indicators
Key Continuation Price Patterns Every Investor Should Know
Trading Indicators
Increase Your Trading Opportunities with Bullish Hammer Candlestick