Lagging indicators have long been a familiar tool for traders seeking certainty in technical analysis. Despite occasional controversy over their “lagging” nature, lagging indicators remain an indispensable weapon when the market is in a clear trend.
What Are Lagging Indicators?
Lagging indicators are a group of technical analysis tools that use past price data to confirm the current market trend. Their main feature is that they only give signals after the trend has been established. This reduces the risk of false signals, but it can also cause you to miss early opportunities.
Typical examples of lagging indicators include moving averages (SMA, EMA) and the MACD. These tools usually work well in strong trending markets but can be noisy when the market is sideways.
Some Typical Examples of Lagging Indicators
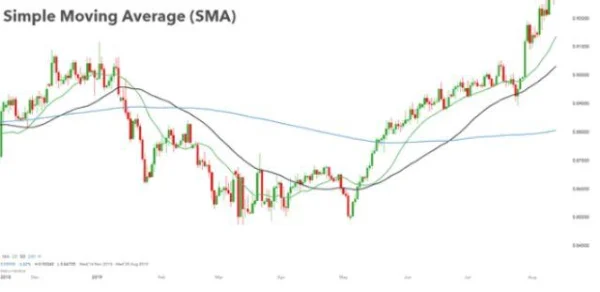
1. Simple Moving Average (SMA)
The SMA calculates the average price over a fixed period. For example, a 50-period SMA will take the average closing price of the last 50 trading sessions. The SMA is typically used to confirm long-term trends.

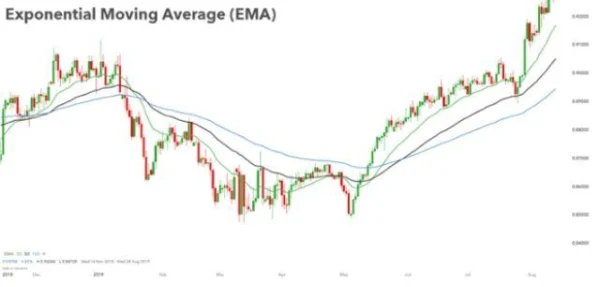
2. Exponential Moving Average (EMA)
The EMA improves on the SMA by giving more weight to recent values, making it more responsive to market fluctuations. In fast-moving markets, the EMA is often preferred.

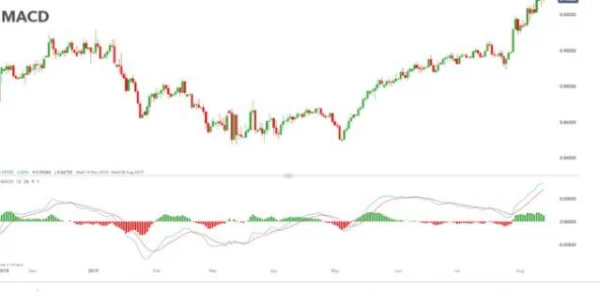
3. MACD
The MACD measures the difference between two EMA lines (usually EMA 12 and EMA 26). It is a popular tool for confirming price momentum, with an important signal being when the MACD line crosses the signal line.

Benefits of Using Lagging Indicators
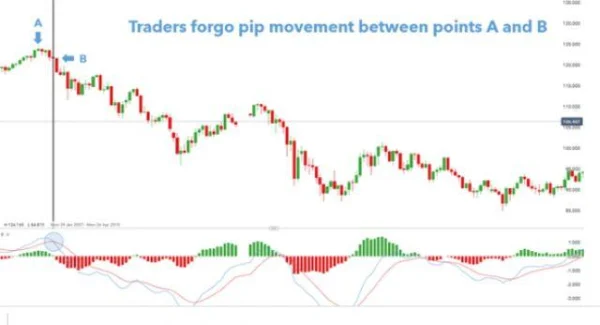
High Reliability Lagging indicators reduce false signals due to their tendency to confirm trends before signaling. For example, on the USD/JPY chart, waiting for the MACD to confirm at point B (after ignoring point A) helps limit risk.

Identifying Entry and Exit Points Tools like the EMA or MACD allow for clearer trading strategies. For example, when the 50-period EMA crosses above the 200-period EMA, it’s a strong buy signal.
Effective in Trending Markets In markets like the U.S. stock market, the SMA or EMA is often used to identify trends in blue-chip stocks. In 2021, the S&P 500 index using the 50-period EMA showed a stable uptrend for most of the year.
“Combine lagging indicators with leading indicators like the RSI or Stochastic. This combination will give you stronger signals, helping you capture early opportunities while minimizing risk.”
Challenges of Using Lagging Indicators
Lagging Leads to Missed Opportunities: Traders often complain that lagging indicators cause them to miss ideal entry points. This is unavoidable due to their “confirmation after” nature.
Decreased Effectiveness in Sideways Markets: When the market lacks a clear trend, lagging indicators often give false signals. This can happen when the market fluctuates within a narrow range, as seen with Tesla stock in Q2 2023.
Although lagging indicators are not perfect, they remain an essential part of every trader’s toolkit. The key is to understand their limitations and use them flexibly based on the current market conditions.
In-Depth Analysis and a Contrarian View on Lagging Indicators
Although lagging indicators like EMA, SMA, and MACD are widely favored in the trading community, they are not perfect tools. In many cases, they create delays that may lead to suboptimal decisions. Below is a deeper look at the issues you may encounter when using these indicators.
1. Lagging Indicators and Missing Opportunities
One of the prominent issues with using lagging indicators is missing out on the best trading opportunities. Consider the case of Amazon (AMZN) in early 2020. When the COVID-19 pandemic began to unfold and online consumer demand surged, Amazon’s stock started to skyrocket. However, indicators like the SMA 50 and EMA 200 only began signaling a buy when the stock had already risen about 30% from its original price. Traders using lagging indicators missed the opportunity to enter when the price was still within a reasonable range.
The truth is that lagging indicators help confirm trends, but in situations like this, you lose the chance to “jump in” the market early. The longer you wait for confirmation from these indicators, the more profit you miss out on.
2. Lagging Indicators in a Sideways Market
Lagging indicators can be very challenging to use in markets without a clear trend (sideways). During these periods, the market oscillates continuously within a narrow range, causing indicators like SMA or MACD to give false signals. They constantly provide buy and sell signals without any clear trend, increasing the likelihood of losses.
A typical example is the German DAX Index in 2018. Throughout that year, the DAX fluctuated between 12,000 – 13,000 points without a strong breakout. Lagging indicators like MACD or SMA were ineffective in this environment, as they were not suited for short-term fluctuations.
3. A Contrarian View: Unexpected Benefits of Lagging Indicators
Although lagging indicators may cause missed opportunities, their “slowness” actually brings some notable benefits. One of the biggest advantages of lagging indicators is that they help minimize “overtrading” and reduce emotional decision-making.
Consider a trading strategy using the MACD. Instead of trading on every small fluctuation, the MACD only confirms trade signals once a larger trend has formed. This helps traders avoid being swept up in short-term volatility, while also avoiding the risk of unnecessary market fluctuations.
4. Lagging Indicators and Strong Trending Markets
One reason lagging indicators are so popular is that they are highly effective in strong trending markets. During these phases, such as in Apple’s (AAPL) growth from 2019 to 2021, lagging indicators help investors track trends and confirm effective entry and exit points.
During the period from March 2019 to December 2020, when Apple grew more than 120%, the EMA lines consistently helped confirm the uptrend, allowing investors to maximize profits in a stable market.
“Remember that lagging indicators are very powerful in trending markets, but in sideways markets, they can become a ‘trap.’ You need to combine these indicators with leading indicators like RSI to minimize risk.”
5. Secondary Signals and Errors in Application
Moreover, when using lagging indicators, traders must be mindful of secondary signals that may arise during trend confirmation. For example, in a strong downtrend, when the MACD enters negative territory but the price continues to rise, you may encounter divergence, a signal suggesting that the trend could reverse soon. This divergence needs to be combined with other signals to make more accurate decisions.
An interesting event occurred in the U.S. stock market in 2022, when the MACD and SMA indicators began showing buy signals for certain tech stocks. However, many investors made the mistake of not paying attention to price divergence—warning signals before the trend actually reversed.
Lagging indicators can be seen as the “loyal friend” of those trading in strong trending markets. However, their delay sometimes causes you to miss opportunities and may lead to false signals in markets without clear trends. The key is to combine them with other strategies, watch for secondary signals, and not forget to analyze the market comprehensively before making decisions.

DLMvn > Trading Indicators > What Are Lagging Indicators? A Comprehensive Guide And Practical Applications
Expand Your Knowledge in This Area
Trading Indicators
Engulfing Pattern: A Reversal Signal in Technical Analysis
Trading Indicators
Clearly Identifying the Flag Pattern in Trading
Trading Indicators
Exploring the Relationship Between Bollinger Bands and MACD
Trading Indicators
Pivot Points: How to Identify Support and Resistance Levels
Trading Indicators
Techniques for Using the Pennant Pattern in Stock Market Investing
Trading Indicators
Piercing Line and How to Use It for Market Top/Bottom Reversal in Trading