Bollinger Bandwidth, a lesser-known but powerful technical indicator, can provide valuable signals about market volatility. When combined with other tools and technical indicators, Bollinger Bandwidth helps traders gain a better understanding of market fluctuations, trends, and potential reversals. However, like any strategy, understanding how to use and analyze this indicator is crucial.
What Is Bollinger Bandwidth?
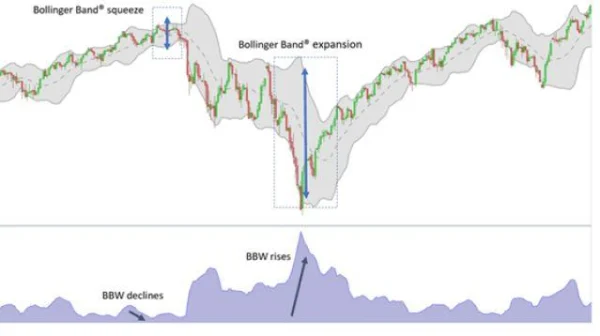
Bollinger Bandwidth is an indicator that measures the percentage difference between the upper and lower Bollinger Bands, reflecting the expansion or contraction of the Bollinger Bands. Essentially, Bollinger Bandwidth allows traders to gauge the market’s volatility, helping them anticipate significant movements in the future.

How Does Bollinger Bandwidth Work?
The formula for calculating Bollinger Bandwidth is quite simple:
Bandwidth = (Upper Bollinger Band – Lower Bollinger Band) / Middle Bollinger Band.
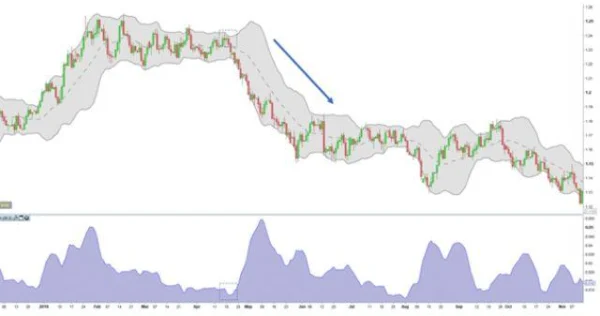
When the width of the Bollinger Bands contracts, it indicates that the market is experiencing a period of low volatility. These periods are often seen as accumulation phases, where the price moves sideways, before a significant movement occurs. Conversely, when Bollinger Bandwidth expands, it signals increased volatility, indicating that a reversal or trend change may be imminent.

For example, after periods of accumulation, when the Bollinger Bands contract, prices tend to make significant moves up or down. These fluctuations are often sudden price surges or drops.
How to Trade with Bollinger Bandwidth
1. Bollinger Bandwidth Low Volatility Strategy
This strategy is applied when Bollinger Bandwidth is low, reflecting low market volatility. For example, in the daily EUR/USD chart, when Bollinger Bandwidth narrows, traders often view this as a sign that a sudden change is about to happen. However, relying solely on Bollinger Bandwidth to decide entry or exit points is not enough. Other indicators need to be combined to confirm the signal.

For example, when Bollinger Bandwidth narrows, you can use signals from the RSI (Relative Strength Index) or MACD to identify overbought or oversold levels in the market. This helps minimize risk and identify more accurate entry and exit points.
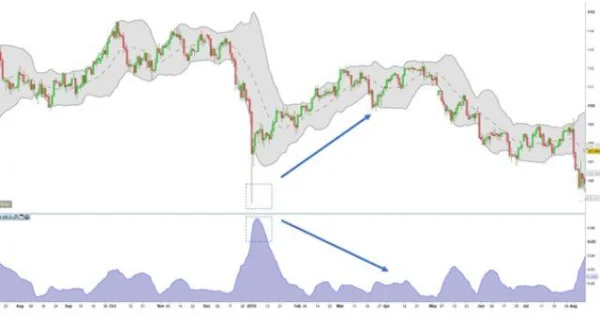
2. Bollinger Bandwidth Reversal Strategy
Another strategy is to use Bollinger Bandwidth to identify potential reversals. When Bollinger Bandwidth increases, it signifies rising market volatility. On the daily chart of USD/JPY, when you see Bollinger Bandwidth sharply increase, it often indicates the emergence of a reversal trend, such as the end of a downtrend and the beginning of an uptrend.

In this case, traders would look for signals from candlestick patterns, such as long wicks, to confirm the reversal. However, Bollinger Bandwidth does not directly provide entry and exit points. Therefore, additional tools such as Fibonacci or support/resistance levels should be used to determine the appropriate entry and exit points.
Advantages and Disadvantages of Using Bollinger Bandwidth
Advantages
- Easy to understand and use: Bollinger Bandwidth is relatively simple and easy to apply for all traders, from beginners to experts.
- Identifies strong volatility: When Bollinger Bandwidth increases, it is a sign of strong volatility, offering high risk/reward trading opportunities.
Disadvantages
- Does not provide entry/exit points: Bollinger Bandwidth does not automatically point out entry and exit points; you need to combine it with other indicators for accurate signals.
- Challenging for new traders: When starting out, many traders may struggle to differentiate between Bollinger Bandwidth signals and those from other indicators. This can lead to confusion and incorrect trading decisions.
A Deep Dive into Bollinger Bandwidth
Bollinger Bandwidth, although regarded as a powerful indicator for identifying market volatility, is not always easy to apply in trading. While some traders believe that using Bollinger Bandwidth helps to identify periods of high or low volatility, there are opposing views suggesting that this indicator can sometimes lead to false signals if not used in conjunction with other tools.
Let’s look at some case studies from global stock markets to better understand how Bollinger Bandwidth works.
1. The US Market: Stocks and Stability
On the US stock market, particularly indices like S&P 500 and Nasdaq, Bollinger Bandwidth is often used to identify strong trend changes. Technical analysts always look for periods when Bollinger Bandwidth narrows, indicating reduced volatility, and wait for a breakout afterward. However, this is not always effective in highly stable markets.
For example, between March and May 2020, when the US stock market saw a strong recovery after the COVID-19 pandemic crash, Bollinger Bandwidth sharply decreased, indicating stability and low volatility. However, shortly after, a strong price surge occurred, but it was not the “breakout” that Bollinger Bandwidth signaled. This indicates that while Bollinger Bandwidth helps identify preparation for volatility, it cannot always predict the exact market direction.
2. The European Market: Predicting Reversals
In contrast to the stable periods in the US market, European stock markets like FTSE 100 and DAX 30 sometimes experience sharp fluctuations in price, making Bollinger Bandwidth a useful tool for identifying reversals. Major events such as Brexit created extremely strong volatility, and Bollinger Bandwidth helped traders identify potential reversal points.
A classic example is in 2016, when Brexit occurred, and Bollinger Bandwidth on the FTSE 100 index spiked, signaling a significant increase in volatility. This was a signal to traders that the trend would change, and indeed, after a period of decline, the market reversed and surged strongly. Traders used Fibonacci combined with Bollinger Bandwidth to identify key support and resistance levels, allowing them to capitalize on this opportunity.
3. The Opposing View: Caution When Using Bollinger Bandwidth
Some analysts argue that Bollinger Bandwidth is not always reliable, especially during periods when the market lacks a clear trend. One of the biggest issues when using Bollinger Bandwidth is that it does not provide clear signals about the market’s direction.
For example, in the US stock market in 2018, when there was a strong correction in indices like Dow Jones and Nasdaq, Bollinger Bandwidth contracted several times. Traders expected a major breakout, but in reality, these expectations did not materialize. The market continued to move sideways for an extended period, and the signals from Bollinger Bandwidth became useless in predicting the trend.
Furthermore, the sharp changes in these indices could have been the result of macroeconomic factors like monetary policy, trade wars, or political crises. These factors cannot be predicted by a single technical indicator like Bollinger Bandwidth, which makes this indicator sometimes lack the precision needed to determine entry/exit points.
4. Advice for Traders
DLMvn always encourages you not to rely solely on one indicator, even though Bollinger Bandwidth proves useful in identifying market volatility. To truly harness the power of Bollinger Bandwidth, you need to combine it with other tools like RSI, MACD, or Fibonacci Retracement to get a comprehensive view of the market.
In practice, Bollinger Bandwidth works best when combined with a diversified trading strategy, using indicators that confirm each other’s signals. For example, if Bollinger Bandwidth narrows significantly and RSI indicates that the market is oversold, this could be a potential buy signal. However, if RSI does not show overbought or oversold conditions, the signal from Bollinger Bandwidth may not be reliable.
If you’re using Bollinger Bandwidth in a reversal trading strategy, combining it with candlestick patterns or signals like Doji or Engulfing will help clearly identify entry points.
Overall, Bollinger Bandwidth is an indispensable tool in the professional trader’s toolkit. However, you must understand how to use it and combine it with other tools to optimize trading results, especially when trading in highly volatile markets like S&P 500 or Nasdaq.

DLMvn > Trading Indicators > Trading with Bollinger Bandwidth: Identifying Accurate Entry Points
Tagged Articles
Discover John Bollinger’s Bollinger Band Rules for Successful Trading
Bollinger Bands
Double Bollinger Bands: Strategy for Predicting Market Volatility
Expand Your Knowledge in This Area
Trading Indicators
Pitchfork and Its Key Benefits in Trading
Trading Indicators
Popular Moving Averages and How to Choose the Best One for Your Strategy
Trading Indicators
Engulfing Pattern: A Reversal Signal in Technical Analysis
Trading Indicators
Discover How to Trade Using the Wedge Pattern
Trading Indicators
Inside Bar: A Powerful Candlestick Pattern for Identifying Entry Points
Trading Indicators
Harami Candlestick Pattern and How to Trade It for Maximum Profit