The Three Inside Up candlestick pattern is a powerful tool for identifying bullish reversal signals on the chart, helping traders recognize the shift from a downtrend to an uptrend. This pattern is a significant one in technical analysis, especially when considered in the context of the global stock market.

Structure and Meaning of the Three Inside Up Pattern
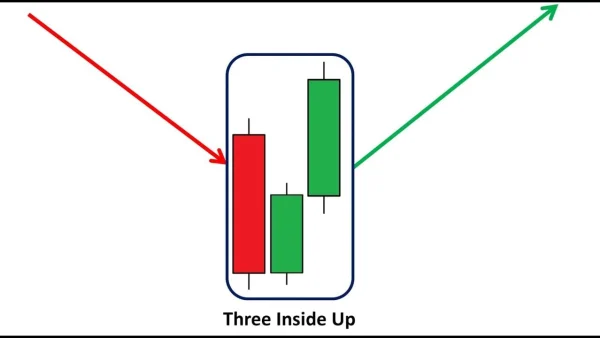
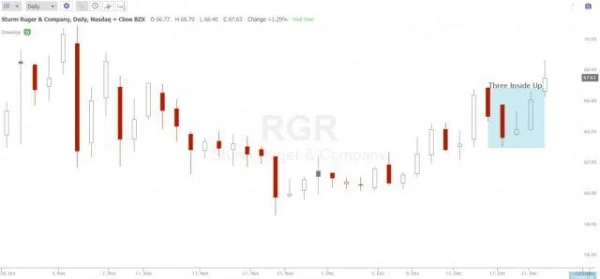
The Three Inside Up pattern consists of three characteristic candlesticks. The first is a strong bearish candlestick, followed by a smaller bullish candlestick that falls within the range of the previous bearish candle. Finally, the third candlestick is a strong bullish candle that closes above the close of the second candlestick. The combination of these three candles creates a strong signal for a bullish reversal.
It is important to note that this pattern does not always provide an accurate reversal signal. However, when it appears in the right context, such as at a strong support level or when technical indicators like RSI are in the oversold region, the success rate of this pattern significantly increases. If it forms near a long-term moving average such as the 50-day or 200-day, the buy signal becomes even stronger.
In a bearish market, when this pattern appears, it signals the beginning of a new uptrend. If the pattern forms in a sideways market, it could indicate a recovery from a consolidation phase. And in an uptrend, it may mark the continuation of that trend after a short correction.
Specific Example of the Three Inside Up Pattern
To better understand the Three Inside Up pattern, imagine you’re watching the price chart of a stock in a downtrend. A strong bearish candlestick appears first, pushing the price down and causing many traders to sell. However, the second candlestick opens higher than the low of the first candle and closes higher than its own opening. This shows the weakening of the bears and the possibility of a bullish reversal.

Finally, the third candlestick is a strong bullish candle that closes above the close of the second candle. This is the signal that buying pressure is gradually taking over, and the bullish reversal is becoming clearer. If you’re watching this pattern, the buy signal will be triggered when the third candlestick closes, and you can place a stop-loss order below the low of the third or even the first candlestick.
However, this pattern does not always yield the desired results. Like any pattern in technical analysis, confirmation from other factors such as support/resistance, RSI, or moving averages will help increase the reliability of the signal.
Three Outside Up: A Similar but Stronger Pattern
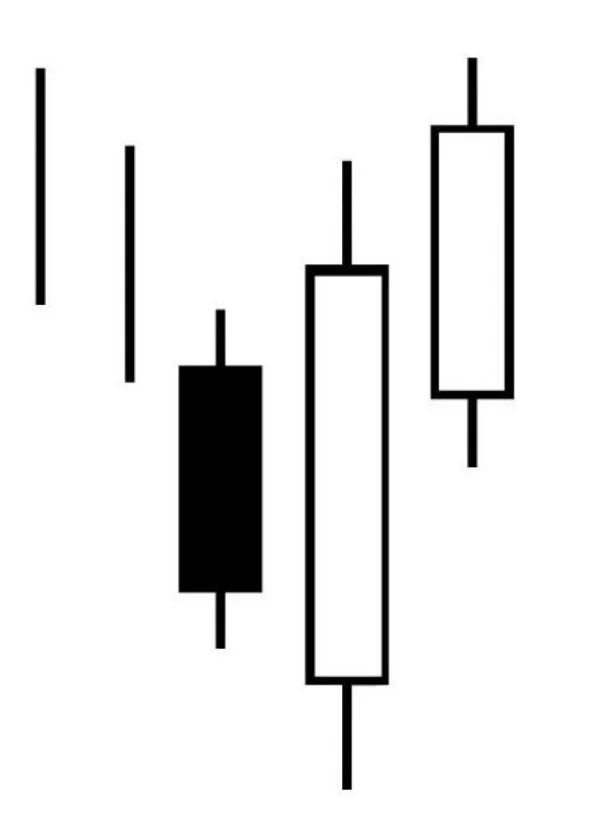
In addition to the Three Inside Up pattern, the Three Outside Up pattern is also a powerful reversal signal, often occurring in a downtrend. This pattern consists of three candlesticks: first, a strong bearish candlestick, followed by a large bullish candlestick that completely engulfs the previous bearish candle, and finally, a strong bullish candlestick that closes above the range of the second bullish candlestick.

The Three Outside Up pattern represents a quick shift in market sentiment, from a bearish state to a bullish trend. What makes this pattern special is that it reflects a strong recovery by the bulls, and if it appears at significant support levels or near long-term moving averages, the likelihood of a reversal is even higher.
If you’re watching the chart and see this pattern, the buy signal will be triggered when the price surpasses the close of the second candlestick, and you can place a stop-loss below the low of the second candlestick. This pattern can help you identify the right time to exit short positions if they are currently at a loss.
The Relationship Between the Pattern and Technical Indicators
One of the key factors when using the Three Inside Up or Three Outside Up patterns is to combine them with other technical indicators to increase the probability of success. For example, if this pattern appears when the RSI is in the oversold region (below 30), or when the price is touching a long-term moving average like the 200-day, the reversal signal will be much stronger.
A case study on the Three Outside Up pattern was conducted on the U.S. stock market, and the results showed that when this pattern forms at significant support levels, the success rate can reach 75% in the short term, with a significantly higher win rate when combined with indicators like MACD or RSI.
In-Depth Insights and Practical Analysis
When it comes to candlestick patterns like Three Inside Up and Three Outside Up, their strength in identifying market trends and reversal signals is undeniable. However, a critical issue that DLMvn often encounters during trading is false signals. These signals can confuse traders, especially when they appear in a market with no clear trend or when market factors haven’t been strongly confirmed.
Challenges and Expert Insights
One of the major challenges when using the Three Inside Up and Three Outside Up patterns is that they don’t always perform as expected. While these patterns can provide strong bullish reversal signals when the market is at a significant support level, if the market context is unclear or lacks confirmation factors, these signals can easily fail.
For example, if the Three Inside Up pattern appears in a market without strong participation from major investors or during a period of price instability, the likelihood of this pattern accurately reflecting the next trend may be reduced. In fact, even the most powerful candlestick patterns can fail if they are not supported by other technical indicators like MACD, EMA, or key trendlines.
Contrary View: Patterns as a Reference Only
A contrary view to consider is that some experts believe candlestick patterns like Three Inside Up or Three Outside Up are merely references, not precise trading signals. This means that while candlestick patterns can help identify shifts in market sentiment, they should be combined with other analysis methods to make accurate decisions.
According to Charles Dow, the founder of the Dow Jones theory, candlestick patterns must be viewed as part of the bigger picture of the market. If you rely solely on one candlestick pattern to make decisions, the risk of failure can be high. One important factor is timing: the Three Inside Up pattern may appear at a support level, but if the market is in a “pause” state or dominated by a prevailing trend, the reversal signal may not be clear.
How to Confirm the Three Inside Up Pattern
So, how can you effectively confirm the signal of the Three Inside Up pattern? DLMvn believes that, in addition to relying on technical indicators like RSI or MACD, confirming this pattern with volume is extremely important. A strong signal will be accompanied by a significant increase in trading volume, indicating the participation of major investors. If the volume is insufficient, the signal from this pattern may not be strong enough to predict a sustainable trend change.
For example, in the U.S. stock market, the Three Inside Up pattern appeared on Apple Inc. (AAPL) stock in April 2023 when the stock price hit a strong support level. However, when this pattern appeared, trading volume decreased significantly compared to previous sessions, leading to a weaker reversal signal than expected. As a result, after the pattern formed, the price only fluctuated within a narrow range before continuing its previous downtrend.
Alternative Patterns: Three Outside Down
In some cases, similar candlestick patterns with the opposite meaning, such as Three Outside Down, may provide more accurate bearish reversal signals. The Three Outside Down pattern consists of a strong bearish candlestick, followed by a bullish candlestick, and then another bearish candlestick that completely engulfs the two previous candles. This pattern shows a strong shift from buying sentiment to selling sentiment.
Real-life example: The Three Outside Down pattern appeared on the chart of Tesla Inc. (TSLA) in September 2022 during a strong uptrend. This pattern warned of a strong impending price drop, and in fact, Tesla’s stock price dropped about 15% in the following three weeks. This demonstrates that accurately identifying bearish signals from the Three Outside Down pattern can be useful, especially when they occur at strong resistance levels or after significant price increases.
The Relationship Between Candlestick Patterns and Market Context Analysis
In the stock market, context is the key factor that determines the effectiveness of the Three Inside Up or Three Outside Up patterns. These patterns will be more accurate if they occur when the market is in an “overbought” or “oversold” state, such as when the RSI is below 30 or within the overbought/oversold zones of the Stochastic Oscillator.
Imagine you’re trading on the U.S. stock market in March 2023. The market has experienced a sharp decline, and many stocks have hit historical support levels. A Three Inside Up pattern appears at this support level, while the RSI is at 28. In this context, the pattern could confirm the likelihood of a bullish reversal with a high probability.
However, if you see the Three Inside Up pattern appear in a strong uptrend without any correction or solid support analysis, the success rate may be lower. Such factors require you to be cautious and always confirm the signal through other technical indicators before making a trade.
“The stock market is not always favorable for candlestick signals. It is important to consider all influencing factors, from market sentiment, price action, to technical indicators, to make an accurate decision.” – DLMvn.
Overall, the Three Inside Up and Three Outside Up patterns are very useful tools for identifying reversal points and the next trend. However, they need to be used with caution and combined with other analysis factors to achieve an optimal trading strategy.

DLMvn > Trading Indicators > Three Inside & Outside Up Candlestick Patterns: Bullish Reversal Signals
Expand Your Knowledge in This Area
Trading Indicators
Popular Moving Averages and How to Choose the Best One for Your Strategy
Trading Indicators
Discover John Bollinger’s Bollinger Band Rules for Successful Trading
Trading Indicators
Discovering Elliott Wave Theory: The Foundation of Market Forecasting Art
GlossaryTrading Indicators
Moving Averages – A Comprehensive Overview
Trading Indicators
Piercing Line and How to Use It for Market Top/Bottom Reversal in Trading
Trading Indicators
Evaluating the Dark Cloud Cover Candlestick Pattern: Opportunity or Trap for Investors?