TABLE OF CONTENTS
- Combining RSI and Fundamentals: A Breakthrough Perspective
- RSI: A Simple Yet Not Simplistic Indicator
- How to Trade with RSI (14)
- Real-World Examples with S&P 500
- Key Factors When Trading with RSI
- Why is RSI Popular Yet Also Criticized?
- A Deeper Perspective: RSI and Market Psychology
- Contrary Viewpoint: Is RSI Really Useful?
- Expansion Suggestions: Integrating RSI into a Comprehensive Strategy
Combining RSI and Fundamentals: A Breakthrough Perspective
When building a trading system, many traders often combine oscillators with trend indicators to enhance accuracy. But have you ever considered relying solely on RSI (14) and a few basic chart concepts to make more effective trading decisions?
DLMvn believes minimalist trading is not just about reducing the number of analytical tools. It’s about selecting entry points with high risk/reward (R:R) ratios. In this article, DLMvn will guide you on combining RSI with strong support and resistance zones to optimize your strategy.
RSI: A Simple Yet Not Simplistic Indicator
Many swing traders favor the default RSI (14) for its stability. However, intraday traders often find RSI too “slow” because trading signals appear infrequently. Some adjust the timeframe or reduce RSI periods to increase sensitivity, but this often leads to unreliable signals.
Minimalist trading demands patience and the ability to identify high-quality opportunities. The core of this strategy lies in combining RSI (14) with critical price zones instead of chasing uncertain signals.
How to Trade with RSI (14)
1. Buy Signals
- RSI (14) below 30 (oversold).
- Price approaches a significant support zone.
- Enter a trade when a bullish candlestick pattern confirms the signal.
2. Sell Signals
- RSI (14) above 70 (overbought).
- Price hits a strong resistance zone.
- Place a sell order when a bearish candlestick pattern forms.
These principles are simple but not easy to execute. The success of the strategy depends on your ability to assess support and resistance levels accurately.
Real-World Examples with S&P 500
1. A Buy Setup in a Sideways Market
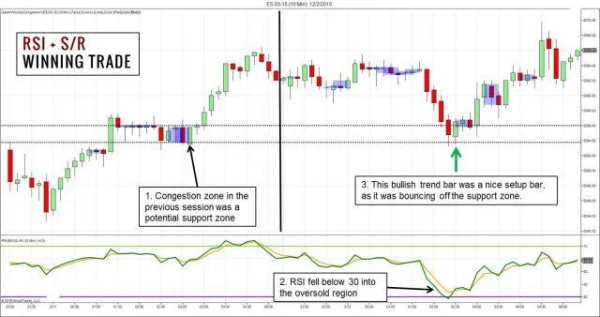
A 10-minute chart of the S&P 500 reveals the following:
- Before prices dropped, a narrow sideways range formed a potential support zone.
- RSI dropped below 30, signaling oversold conditions.
- When RSI bounced back above 30, a bullish inside bar candlestick pattern appeared, offering an ideal entry point.

In this case, the strategy worked effectively due to the combination of support analysis and RSI signals.
2. A False Sell Signal
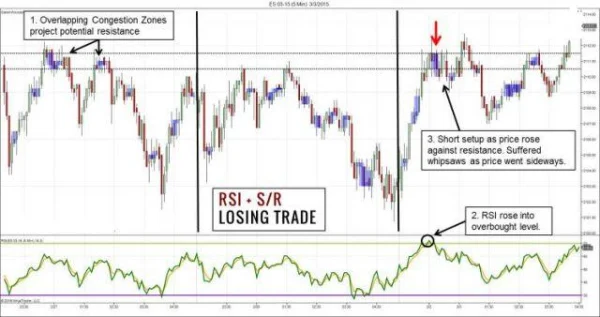
However, not all trades succeed. Let’s examine another example:
- RSI crossed above 70 as price neared a resistance zone.
- A strong bearish candlestick appeared, signaling a sell opportunity.
- However, the market only dipped slightly before breaking through the resistance zone, causing the trade to fail.

This mistake highlights the importance of precise timing. Inaccurate analysis can lead to rushed decisions.
Key Factors When Trading with RSI
-
Identify Support and Resistance
Mark key price zones based on market structure. These serve as the foundation for evaluating signal quality. -
Use RSI Alerts
Set up alerts for overbought/oversold conditions to ensure you don’t miss opportunities. -
Backtest the Strategy
When implementing this strategy, test and record results in a simulated environment. Integrating automation tools to identify price zones or candlestick patterns can save time.
Tip: Always pair this strategy with strict capital management. A single losing trade is manageable if you’ve carefully calculated the risks.
Why is RSI Popular Yet Also Criticized?
The Relative Strength Index (RSI) is one of the most widely used tools in the global stock market. Its appeal lies in its simplicity and high applicability. However, it doesn’t always receive unanimous agreement.
Advantages of RSI: A Tool for Streamlined Traders
- Easy to Use: With just two levels, 30 and 70, RSI immediately shows whether the market is overbought or oversold. This is particularly helpful for beginners.
- Reliability in Sideways Markets: In market phases with no clear trend, RSI often performs well in identifying potential reversal points.
- Flexible Integration: RSI can be combined with other tools such as Fibonacci, moving averages, or candlestick pattern analysis, creating more complex trading systems.
Limitations of RSI: The Dark Side of a Simple Tool
- Poor Performance in Strong Trending Markets: In markets with continuous upward or downward movements, RSI often gives incorrect overbought/oversold signals. This occurred with the NASDAQ Composite index in 2020 when RSI stayed in the overbought region for several weeks without a significant pullback.
- Sensitivity Depends on Timeframe: When reducing the number of periods for RSI (e.g., from 14 to 7), the signals become faster but much less accurate. This leads to noisy signals, resulting in unreliable trade decisions.
- Not Suitable for Highly Volatile Markets: In major events like the 2008 financial crisis, RSI often exceeded the 30 or 70 thresholds without causing any reversals, causing many investors to incur losses.
A Deeper Perspective: RSI and Market Psychology
RSI is not just a lifeless number; it reflects crowd psychology. When RSI enters the oversold region (below 30), it often indicates a fear-driven market. On the other hand, an RSI above 70 represents greed, as investors rush to buy stocks without considering valuations.
For instance, in 2021, Tesla (TSLA) had an RSI above 85 for several weeks as retail investors on Reddit pushed its stock price up. Nevertheless, Tesla continued to grow strongly before correcting, demonstrating that RSI is just an indicator, not a prophecy.
Contrary Viewpoint: Is RSI Really Useful?
Some financial experts argue that RSI has become outdated in the age of algorithmic trading. Modern AI systems often use more complex data such as trading volume, cash flow, or social sentiment analysis to make decisions. This makes RSI appear too simple compared to other advanced tools.
However, it’s undeniable that the simplicity of RSI is what gives it power, especially for individual traders who lack access to large data sets.
Expansion Suggestions: Integrating RSI into a Comprehensive Strategy
-
Combine with DMI (Directional Movement Index): In strong trending markets, adding DMI to RSI will help filter out false signals. If DMI confirms the trend, you can avoid false RSI signals.
-
Use Custom RSI Levels: Instead of the default 30-70, try adjusting to 20-80 in low-volatility markets or 40-60 in stable markets. This is how many professional traders on Wall Street optimize their strategies.
-
Utilize RSI Divergence: Divergence between RSI and price often provides stronger signals than standard threshold levels. For example, if the price is making lower lows but RSI is making higher lows, it could be an early sign of a reversal.
Tip: Take the time to test customized RSI levels for the stocks or indices you trade. Don’t hesitate to adjust as the market changes.
DLMvn believes that no tool is perfect in trading, but RSI will always be an essential part of an investor’s toolkit if used correctly.

DLMvn > Trading Indicators > Streamlining Strategies: Mastering RSI to Maximize Profits
Expand Your Knowledge in This Area
Trading Indicators
4 Ways to Leverage Support and Resistance for Optimal Trading
Trading Indicators
An Introduction to the 5 Doji Candle Patterns
Trading Indicators
What is the Shooting Star Candlestick Pattern? Meaning and How to Identify It
Trading Indicators
Exploring the Relationship Between Bollinger Bands and MACD
Trading Indicators
Piercing Line and How to Use It for Market Top/Bottom Reversal in Trading
Trading Indicators
Engulfing Pattern: A Reversal Signal in Technical Analysis