TABLE OF CONTENTS
- Why Identify Support & Resistance?
- Past Highs and Lows
- Using EMA Lines
- Experience and Practice
- Contrary Views and Profound Insights About Support and Resistance
- The Possibility of Re-testing Support and Resistance Levels
- Challenges in Identifying Support and Resistance Levels
- Common Mistakes to Avoid
- Advice for Investors
In the stock market, you’ve probably heard a lot about the concepts of support and resistance. Generally, many people think that support occurs when there are more buyers than sellers, while resistance forms when sellers dominate the buyers. However, the reality is much more complex. A large player can buy aggressively, overpowering hundreds of sellers and pushing the market upward. Conversely, a large player can sell and drive the price down, even with thousands of buyers. So, what truly causes market changes?
It’s not the number of buyers or sellers that matters, but the size of the buy and sell orders. Support is where buying volume dominates, while resistance is where there are more sell orders. A simple way to understand this is to think of support as the floor and resistance as the ceiling. If you throw a ball on the floor, it will bounce up. If you throw the ball at the ceiling, it will fall back down.
Why Identify Support & Resistance?
DLMvn is sure you’ve heard a lot about the importance of identifying support and resistance areas on charts. But why are these levels so important? Simply put, these are price levels where the market could reverse direction. Accurately identifying these levels can help you make better trading decisions. For instance, if the market is fluctuating in a sideways range and is close to an important support level, this could be a good opportunity to look for buying points. Conversely, if you hold a long position, you may want to close the trade or at least take some profit when the price is near a key resistance level.
Support and resistance levels not only help you determine when to enter a trade but also serve as points to seek profit. To do this, you can use the simple analytical tools below.
Past Highs and Lows
Past highs and lows are basic yet highly effective support and resistance indicators, especially in sideways markets. These price levels reflect the crowd’s psychology and are where buying or selling pressure is strong enough to reverse the price. Therefore, when the price revisits these levels, there is a high chance that the market will reverse. However, DLMvn would like to emphasize that you should not enter trades immediately at these price levels without clear confirmation from the market.
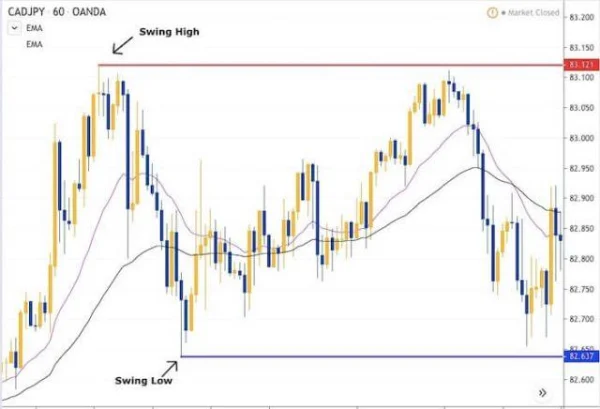
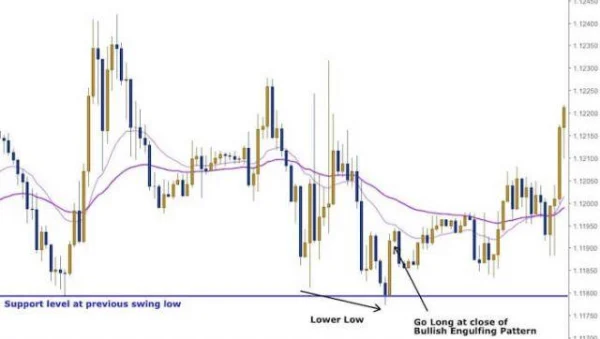
For example, if the market approaches a past low, you should wait for a breakout below that level. After the price breaks below the old support level, don’t rush to enter a trade immediately. Wait for the market to form bullish candlestick patterns, such as Bullish Pin Bar, Bullish Piercing, or Bullish Engulfing. It is crucial that the price closes above the support level it just broke. At this point, you can place a stop loss just below the candlestick pattern to protect your position.
Using EMA Lines
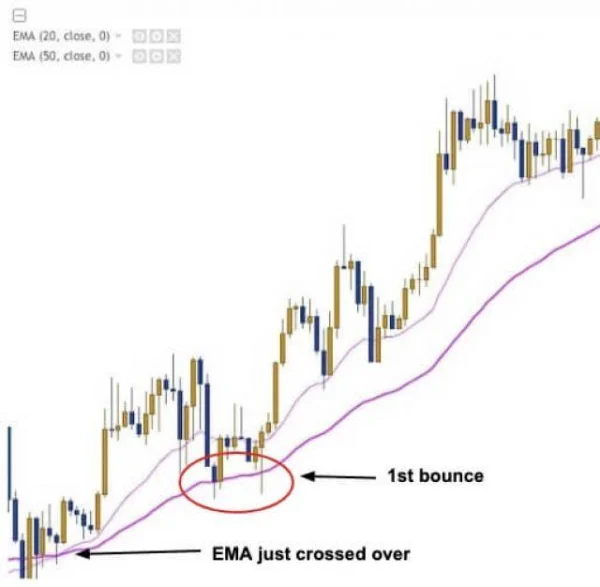
Another method for identifying support and resistance levels is using Exponential Moving Averages (EMA). However, unlike fixed support and resistance levels, EMA levels are dynamic and especially useful in trending markets. For example, when using the 20 EMA and 50 EMA, you will often see the price bounce after touching these levels. This is a classic example of dynamic support levels.
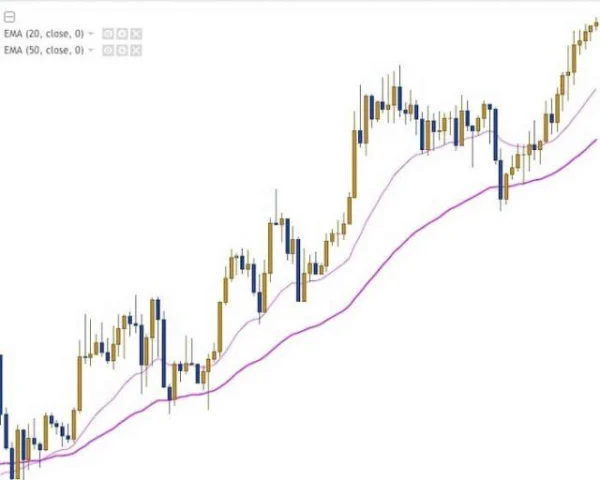
In the chart above, the market bounced multiple times after touching the EMA lines. However, in weak markets, this method may not be effective as the price frequently crosses the moving averages. Therefore, just like identifying fixed support and resistance levels, you need to wait for a candlestick pattern confirmation before entering a trade.
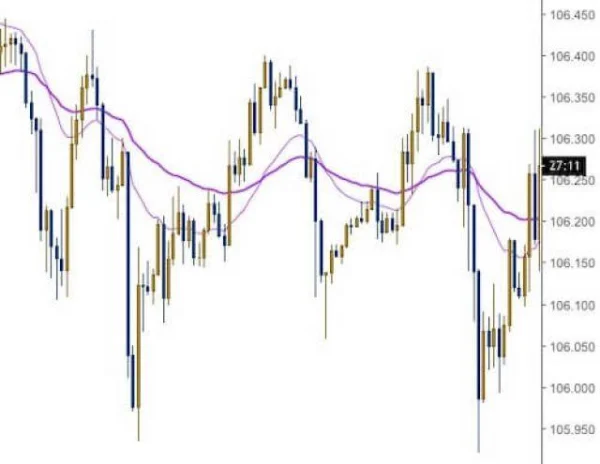
For example, in an uptrend, when the 20 EMA is above the 50 EMA, and the market pulls back to the 50 EMA, you will need a bullish candlestick pattern such as Bullish Engulfing or Bullish Pin Bar to confirm the entry point. At this point, you can enter a buy trade and set your stop loss just below the bullish candlestick pattern.
Experience and Practice
Both when identifying support and resistance and when using EMA, it’s essential to have confirmation from a candlestick pattern before entering a trade. This helps minimize risk and increase the winning rate in your trades.
However, it’s important to note that support and resistance levels cannot always be predicted accurately. The market always has unexpected factors, so you must be patient and avoid rushing into trading decisions. Watch the market closely, analyze it carefully, and always have a solid risk management strategy in place to protect your trades.
Contrary Views and Profound Insights About Support and Resistance
DLMvn cannot overlook an important point that many investors often ignore when trading with support and resistance levels: The Uncertainty of the Market. Many people assume that once the price hits a support or resistance level, it will immediately reverse. However, the reality is that the market does not always “behave” as we expect. Sometimes, the price can break through the support or resistance level and continue moving in the trend, which can lead impatient investors to face losses.
A typical example could be the price correction in the U.S. stock market in 2020, when the S&P 500 broke through strong support levels during the Covid-19 pandemic and continued to decline. This is a clear example that support levels are not always safe and resistance levels do not always hold.
This brings a contrary view to how many people apply this method. Some analysts may argue that focusing too much on support and resistance levels is a major risk. Especially when the market experiences sudden moves due to macro factors. These factors can completely change the crowd’s sentiment and lead to a break of support or resistance levels without clear signals.
However, from a technical perspective, support and resistance levels are still incredibly important tools. DLMvn firmly believes that with confirmation signals from candlestick patterns, such as Bullish Engulfing or Bearish Engulfing, you can trade with a better-controlled level of risk.
The Possibility of Re-testing Support and Resistance Levels
One aspect that DLMvn sees little mention of is the possibility that the market will re-test support and resistance levels before deciding to continue the trend. In fact, this happens quite frequently in volatile markets.
The way support and resistance levels work is not just simply when the price hits, it will reverse. When the price breaks through an important support or resistance level, the market may return to re-test that level. This is called a retest, and it is crucial in confirming the strength of the breakout.
For example, in the U.S. stock market before the 2008 financial crisis, the Dow Jones Index repeatedly broke through support levels, then came back to re-test and continued its strong downward trend. This shows that when a support level is broken, it is not the end, but an opportunity for investors to confirm the trend. This can provide more confidence in trading decisions.
Challenges in Identifying Support and Resistance Levels
One of the biggest challenges when using support and resistance levels is accurately identifying the exact price levels. Often, support and resistance levels are not rigid straight lines but fluctuating zones. Therefore, sometimes the assessment of the importance of a support or resistance level can be subjective and dependent on each person’s analysis. This makes trading based solely on support and resistance levels a double-edged sword.
Investors need to understand that there is no method that is absolutely accurate. DLMvn always emphasizes that when using support and resistance, you need to combine other tools such as trend lines, MACD indicators, or RSI to increase accuracy in forecasting. Using only support and resistance levels can cause you to miss important signals.
Common Mistakes to Avoid
A common mistake DLMvn sees among many investors is entering trades too early when the price hits support or resistance levels without waiting for confirmation signals. This can lead to failure because the market can always change suddenly, as seen in many cases when the price breaks through support or resistance without any signs of reversal.
Another mistake is over-relying on support and resistance levels in a strong trending market. When the market is in a strong trend, support and resistance levels may not be enough to hold the price. In such situations, it is best to look for signals of a new trend rather than maintaining a conservative view just because the price has touched a support or resistance level.
Advice for Investors
DLMvn always advises you that when trading with resistance and support, never forget to manage risk. Properly identifying stop loss and take profit levels plays an important role in any trading strategy. And if you are trading based on support and resistance levels, remember that patiently waiting for market confirmation is very important. Do not rush, because sometimes, it is the slowness and caution that help you win in trades.
Only when you fully understand and evaluate the factors affecting the market can you use support and resistance as effective tools to optimize profits and minimize risks in stock trading.

DLMvn > Trading Indicators > Simple Trading Strategy with Support and Resistance
Tagged Articles
4 Ways to Leverage Support and Resistance for Optimal Trading
Expand Your Knowledge in This Area
Trading Indicators
Exploring the Relationship Between Bollinger Bands and MACD
Trading Indicators
Engulfing Pattern: A Reversal Signal in Technical Analysis
Trading Indicators
Essential Knowledge For Trading With Price Channels
Trading Indicators
Trading with Bollinger Bandwidth: Identifying Accurate Entry Points
Trading Indicators
10 Candlestick Patterns Every Trader Should Know
Trading Indicators
What Are Lagging Indicators? A Comprehensive Guide And Practical Applications