TABLE OF CONTENTS
- Moving Averages and Trading Time Frames
- Moving Averages and Crossover Signals
- Moving Averages in Trend Trading
- What is the Best Moving Average?
- Limitations of Moving Averages
- Contrary Viewpoint: Moving Averages Are Not Always Effective
- Real-World Example from the U.S. Stock Market
- Moving Averages and Long-Term Trading
- Optimizing Trades with Moving Averages
Moving Average (MA) is an essential tool in technical trading, used to measure and react to price action. However, a question many traders ask is: “Which moving average is the best?”
Moving Averages and Trading Time Frames
Although it cannot predict, the moving average helps display the price trend on the chart, indicating when the price is above or below the moving average, which may reflect an uptrend or downtrend. One thing to remember is that moving averages are not an absolute indicator, but just a tool for analyzing and tracking price action.
DLMvn believes that the question “Which moving average is the best?” can actually be answered if you clearly understand “what is your trading time frame?” The time frame difference can determine which type of moving average you should use.
1. Popular Time Frames for Traders
Scalpers mainly work with extremely short time frame charts, such as 1 minute or even shorter. Meanwhile, day traders typically choose time frames from 5 minutes to 15 minutes for their trade decisions. Some traders may combine moving averages in time frames from 5 to 20 minutes to apply short-term trading strategies.
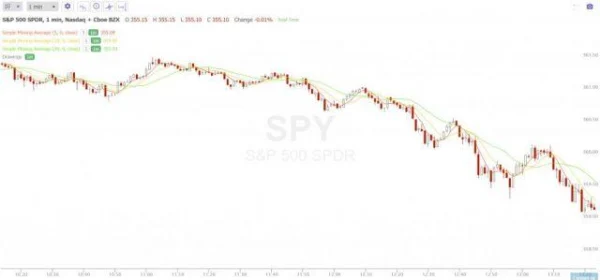
When using moving averages in short time frames, you will see their effectiveness in filtering signals, reducing noise, and helping you identify trends more clearly. For example, combining moving averages like 5 minutes, 10 minutes, and 20 minutes can yield optimal results for day trading.
2. Short-Term Traders and the Importance of Moving Averages
Short-term traders or those holding positions overnight may choose a time frame of 1 hour or combine 15 minutes and 30 minutes time frames to trade for a few hours or days. Moving averages in these time frames help provide accurate signals, and reviewing the relationship between price and the moving average from historical data helps traders find effective trading opportunities.
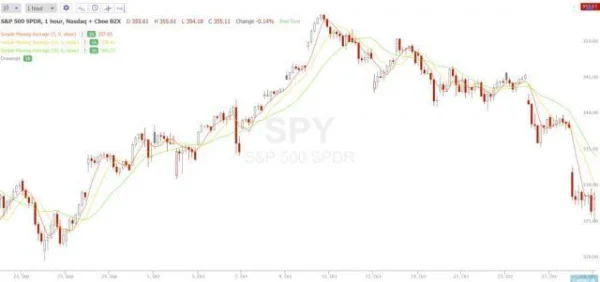
For day traders, the best moving average is one that fits the time frame they are trading in. If you are a short-term trader, a moving average in the range from 5 minutes to 1 hour might be the right choice.
Moving Averages and Crossover Signals
When studying crossover signals, DLMvn has found that moving averages can create powerful signals when they cross, especially in trend-following trades.
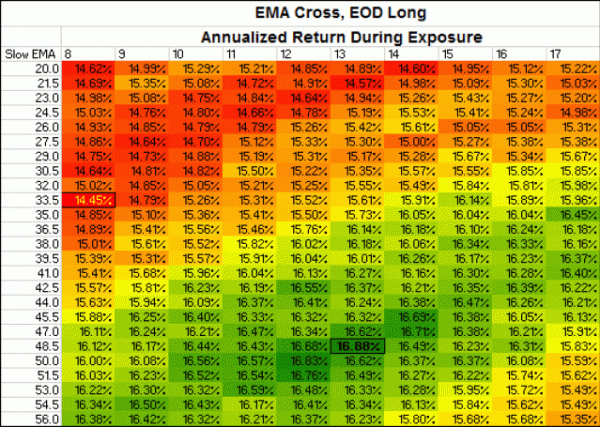
One of the most powerful signals DLMvn has tested for over 15 years is the crossover of the 10-day EMA and the 50-day EMA. This is a great signal for confirming market trends. For example, when the 10-day EMA crosses above the 50-day EMA, it signals an uptrend, and when it crosses below, it signals a downtrend. This crossover signal allows traders to enter and exit trades quickly and accurately.
Additionally, long-term testing also indicates that trading strategies based on the 200-day moving average are effective when filtering long-term trends. When the price crosses above the 200-day moving average, it signals a long-term uptrend, and when the price crosses below, it signals a long-term downtrend.
Moving Averages in Trend Trading
For long-term trend traders, moving averages such as 50-day, 100-day, 200-day, and 250-day are commonly used in trades lasting several days or weeks. For these traders, the SMA (Simple Moving Average) is often more suitable, as it can provide stronger support and resistance levels when the price pulls back and crosses key levels.
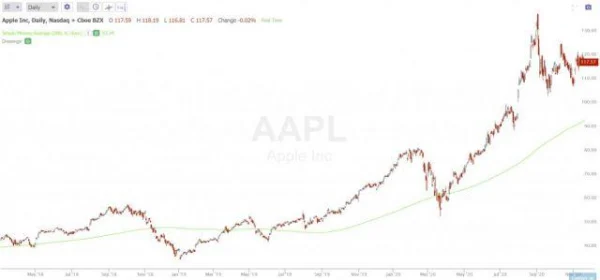
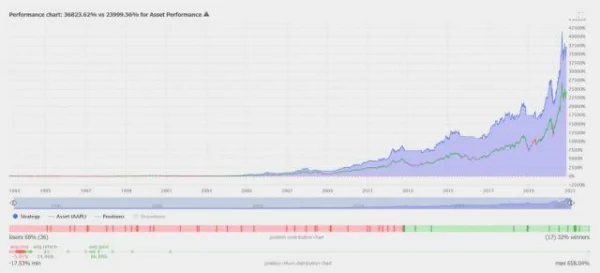
Signals from these long-term moving averages can help you identify long-term trends and enter trades with high confidence. For example, if the price rises above the 200-day moving average, you might open long-term buy positions and hold them until the price crosses below this level.
What is the Best Moving Average?
The answer to this question truly depends on your goals and trading style. Traders need to clearly understand their trading time frame, risk tolerance, and the strategies they are applying. The best moving average is the one you can use to optimize your ability to make money and manage risk.
The best way to make money from moving averages is to create an effective risk/reward ratio. Using reasonable stop-loss levels in conjunction with moving averages will help protect profits and minimize losses in unfavorable trades.
Limitations of Moving Averages
Although widely used, moving averages are not the “magic” tool that many traders hope for. One important point that DLMvn wants to emphasize is that the advantage of moving averages lies in their ability to react quickly to price action, but at the same time, they do have a certain degree of lag. This can lead to delayed trading signals and missed opportunities during volatile market conditions.
For example, when using EMA (Exponential Moving Average), while they are more responsive than SMA (Simple Moving Average), in some cases, signals can be distorted if the market is highly volatile. During major events, such as the earnings reports of a large company or a geopolitical event, moving averages may not be able to quickly reflect significant price changes.
Furthermore, one of the biggest challenges is that in a market without a clear trend (sideways market), moving averages can generate false signals. This can lead to incorrect entries and losses.
Contrary Viewpoint: Moving Averages Are Not Always Effective
A contrary viewpoint that DLMvn wants to share is that moving averages do not always provide optimal results. Particularly in markets without a clear trend, moving averages can cause noise signals. In such cases, trading strategies relying on other indicators such as RSI (Relative Strength Index) or MACD (Moving Average Convergence Divergence) can yield more accurate results.
In fact, many professional traders have pointed out that when the market is stable and there are no significant fluctuations, moving averages cannot provide enough information for trading decisions. Meanwhile, traders who focus on price pattern analysis or use Price Action analysis might be able to make better decisions.
Real-World Example from the U.S. Stock Market
A specific example from the U.S. stock market is the sudden change in the S&P 500 in 2020 during the COVID-19 pandemic. In the early months of the year, the 200-day moving average of this index appeared to identify a clear uptrend, but within just a few weeks, as negative news from the pandemic began to spread, the market fell into a major crisis, and the moving average was unable to react. Trading signals based on the MA during this time were useless and could not help traders predict the sharp reversal.
Another event occurred in 2018, when Amazon (AMZN) was affected by news from the U.S. government regarding tax policy and production costs. During that period, the 50-day EMA failed to reflect the sharp weakening of the stock as the market reacted strongly to this information.
In contrast, in the case of Tesla (TSLA), when the stock was in a strong growth phase, signals from moving averages like the 10-day and 50-day accurately reflected the trend and helped many investors make profits.
Moving Averages and Long-Term Trading
DLMvn does not deny that long-term moving averages, especially the SMA 200-day, are a powerful tool for filtering long-term trends. However, it must also be acknowledged that these strategies are not always easy to implement, especially for those who lack experience or do not have enough time to monitor the market continuously.
In practice, when using the 200-day moving average to identify trends, traders will inevitably face sharp corrections in the short term. A recent study by Goldman Sachs showed that signals from the 200-day moving average can help filter long-term trends, but they also frequently lead to incorrect decisions in markets with unexpected reversals.
Optimizing Trades with Moving Averages
To make the most of moving averages, an effective method is to combine them with other indicators such as RSI or MACD. This not only helps increase the accuracy of trading signals but also minimizes noise signals in markets without a clear trend.
For example: One popular strategy is to combine the 50-day EMA with RSI. When the price crosses above the 50-day EMA and the RSI is between 30 and 70, this is a strong signal indicating that the uptrend will continue. On the other hand, if the RSI is in the overbought or oversold region, using the EMA can help identify potential reversals.
In these cases, real data from investment funds shows that combining such tools can help traders achieve higher win rates, especially in short-term trades.

DLMvn > Trading Indicators > Popular Moving Averages and How to Choose the Best One for Your Strategy
Tagged Articles
Discover How to Combine Moving Averages with Candlestick Patterns Effectively
Moving Averages – A Comprehensive Overview
Expand Your Knowledge in This Area
Trading Indicators
Hanging Man: A Reversal Candlestick Pattern
Trading Indicators
Understanding MACD: The Key to Enhancing Your Investment Strategy
Trading Indicators
An Introduction to the 5 Doji Candle Patterns
Trading Indicators
Harami Candlestick Pattern and How to Trade It for Maximum Profit
Trading Indicators
Discover John Bollinger’s Bollinger Band Rules for Successful Trading
Trading Indicators
Exploring the Relationship Between Bollinger Bands and MACD