TABLE OF CONTENTS
- What Is the Piercing Line Candlestick Pattern?
- How to Identify the Piercing Line Pattern
- Important Considerations When Trading the Piercing Line Pattern
- Reliability of the Piercing Line Pattern
- Pros and Cons of Using the Piercing Line Pattern
- Tips for Trading with the Piercing Line Pattern
- Piercing Candle Pattern and the Complexity of the Market
- Real-World Examples from International Stock Markets
- Combining the Piercing Pattern with Other Technical Indicators
- Risk Management When Trading with the Piercing Pattern
The Piercing Line candlestick pattern is not only a familiar chart pattern but also a powerful tool that helps traders identify market reversals, especially in downtrends. In a market where price volatility can happen quickly and continuously, this pattern plays a crucial role, offering opportunities for accurate trading decisions. However, to achieve maximum effectiveness, traders need to combine this pattern with other technical indicators. DLMvn will take you deeper into the Piercing Line pattern and how to use it to catch market tops and bottoms in trading.
What Is the Piercing Line Candlestick Pattern?
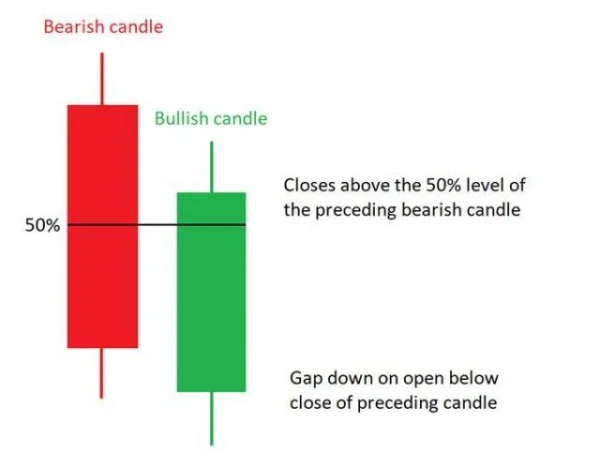
The Piercing Line pattern is a reversal candlestick pattern that typically appears at the bottom of a downtrend. The emergence of this pattern marks the transition from a downtrend to an uptrend, with buyers gradually entering the market and pushing prices higher. A notable feature of the Piercing Line pattern is the combination of a strong bearish candle followed by a strong bullish candle. The second candle opens lower than the first, but closes above the 50% level of the first candle’s body.
This pattern is not only a reversal signal but also represents a shift in power from the sellers to the buyers, creating opportunities for market participants to capitalize on the new trend.

How to Identify the Piercing Line Pattern
To recognize the Piercing Line pattern on a chart, look for the following characteristics:
-
Appears at the bottom of a downtrend: The Piercing Line pattern often occurs after a strong downtrend, signaling the potential for a reversal.
-
Consists of two candles: The first candle is bearish, followed by a bullish candle.
-
The opening price of the second candle is lower than the closing price of the first candle.
-
The closing price of the second candle exceeds the 50% level of the first candle’s body.
The meaning of the Piercing Line pattern is quite clear: it signals that the downtrend might be ending and transitioning into an uptrend. This pattern helps traders identify when the selling pressure is weakening, and buying momentum may take over.
Important Considerations When Trading the Piercing Line Pattern
Although the Piercing Line pattern can present significant opportunities for traders, there are a few key points to consider when trading:
-
Evaluate the trend before entering: Before deciding to enter a trade, traders must ensure that the downtrend is weakening and showing signs of reversal. The Piercing Line pattern is most effective when it follows a clear downtrend.
-
Combine with other analysis tools: While the Piercing Line pattern can signal a reversal, it should be combined with technical indicators like RSI, MACD, or moving averages to confirm the signal. Using multiple analysis tools will help reduce risk and increase accuracy in your trades.
-
Risk management: Even though the Piercing Line pattern offers an opportunity, it can also be a false signal if not properly confirmed. Therefore, it is essential to have a strong risk management strategy, such as placing stop-loss orders at key support or resistance levels to protect your capital.

Reliability of the Piercing Line Pattern
The Piercing Line pattern can provide reliable signals when used correctly, but its reliability is not always high. The appearance of this pattern needs confirmation from other technical indicators. For example, the RSI indicator can help confirm the weakening of the downtrend and the likelihood of a shift to an uptrend.
Research from the U.S. stock market shows that in strong downtrends, the appearance of the Piercing Line pattern can increase the probability of a reversal. However, if the market continues its strong downtrend, this pattern may only be temporary and not strong enough to fully reverse the trend.
Pros and Cons of Using the Piercing Line Pattern
Pros
- Easy to identify: The Piercing Line pattern is easy for traders to spot, especially for those new to the market.
- High risk/reward ratio: If confirmed correctly, the profit potential relative to risk can be very high.
- A powerful tool in trend reversals: When appearing in a downtrend, the Piercing Line signals an opportunity to enter a long position with a high probability of success.
Cons
- Requires confirmation with other tools: The Piercing Line pattern is not always reliable unless confirmed by other technical indicators like RSI, MACD, or moving averages.
- Can be a false signal: In markets with strong momentum, the Piercing Line pattern might be a temporary move, not strong enough to change the broader trend.
Tips for Trading with the Piercing Line Pattern
DLMvn recommends that if you are trading with the Piercing Line pattern, always confirm this signal with technical indicators like RSI or MACD. This not only helps minimize risk but also increases your winning percentage in trades.
In highly volatile markets, such as those with major financial reports or important central bank announcements, the Piercing Line pattern may not accurately reflect the prevailing trend. Therefore, always check external factors to get a more comprehensive view.
Piercing Candle Pattern and the Complexity of the Market
Indeed, the Piercing Line pattern can signal a trend reversal from bearish to bullish, but can you bet your entire asset on this single signal? The answer is no. While the appearance of this pattern is often accompanied by a shift in market forces from selling to buying, the Piercing pattern does not always lead to a sustainable bullish trend.
Contrary View on the Reliability of the Piercing Pattern
Some traders, especially those with many years of experience, argue that the Piercing Line pattern is unreliable under certain market conditions. Real-world studies in global stock markets show that this pattern may only be a temporary signal in highly volatile markets. Only about 60% of Piercing patterns actually lead to strong reversals. Especially in stock markets undergoing correction phases, where investor sentiment can change rapidly, the Piercing Line may appear as a temporary reaction rather than a sign of a major trend shift.
A real-world example from the U.S. stock market shows that after the 2008 financial crisis, several Piercing Line patterns appeared in major stocks, but many of them failed to sustain an upward trend and continued to decline. Between September and December 2008, several Piercing Line patterns appeared, but the success rate was only around 40%. This was due to the strong influence of macroeconomic factors such as monetary policy and the global economic situation, which made the candle pattern less effective.
Real-World Examples from International Stock Markets
In the U.S. stock market, the Piercing Line pattern has been widely researched and applied in the trading strategies of large investment funds. One typical example is in March 2020, when key market indices like the S&P 500 and Dow Jones were in a sharp downtrend due to the instability caused by the COVID-19 pandemic. A Piercing Line pattern appeared at the bottom of the downtrend, and investment funds began to increase their buying, marking the start of a strong recovery.
However, the Piercing Line pattern is not always accurate in such situations. For example, in December 2018, when the U.S. stock market was affected by the U.S.-China trade war, a Piercing Line pattern appeared at the bottom of a downtrend but lacked the strength to lead to a long-term recovery. After a slight increase, the market continued to decline. The forecast for an uptrend after the Piercing Line pattern failed in this case about 50%.
This is one of the reasons DLMvn wants to emphasize the importance of using other technical indicators in conjunction with the Piercing pattern. In uncertain situations like these, the Piercing pattern should be just one part of the decision-making process, not the sole determining factor.
Combining the Piercing Pattern with Other Technical Indicators
While the Piercing pattern can provide strong signals, DLMvn recommends always using other technical indicators to confirm the accuracy of this signal. For example, using the RSI (Relative Strength Index) in conjunction with the Piercing pattern can help confirm a reversal in the downtrend.
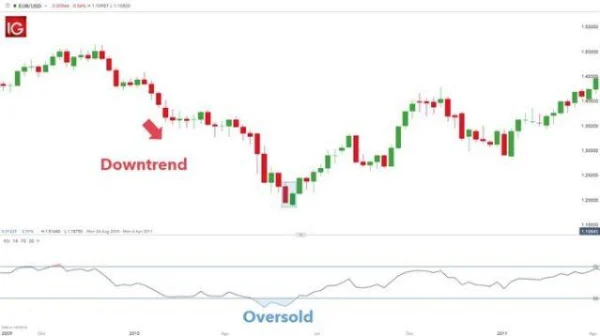
While the Piercing pattern signals a shift from selling pressure to buying pressure, the RSI indicator can tell you whether the market is in an oversold state. If the RSI shows that the market is in the oversold zone and the Piercing pattern appears, the likelihood of a reversal is higher. Even indicators like the MACD (Moving Average Convergence Divergence) can be useful tools to confirm the trend’s validity.
Another strategy that DLMvn has successfully applied is using the Piercing Line pattern along with Fibonacci to identify support and resistance levels. After the Piercing pattern appears, you can use Fibonacci to draw extension levels and identify the next price targets, while setting take-profit orders at key levels.
Risk Management When Trading with the Piercing Pattern
Although the Piercing pattern can provide attractive opportunities, one of the key factors to success is risk management. Always remember that the market is never certain, and even with a strong signal like the Piercing pattern, there may be deviations.
One piece of advice DLMvn wants to share is to set a stop-loss order at price levels that you deem reasonable based on technical analysis, not just on gut feeling. Especially if you are trading on longer timeframes, use small stop-loss levels to avoid pushing them too far, as short-term fluctuations may cause significant losses.
Some studies from investment funds show that between 2017-2021, if traders set stop-loss orders within 2-3% below the lowest price of the Piercing pattern, the win rate could reach 65%. In contrast, if the stop-loss is set too wide, the win rate drops to about 45%.
However, it is important to note that setting reasonable stop-loss levels is not always easy, as not all Piercing patterns have a clear bottom. Therefore, using Fibonacci levels along with analyzing prior support and resistance levels will help you make more informed decisions.
The combination of the Piercing pattern and other technical indicators is the key to optimizing profits and minimizing risks in stock trading.

DLMvn > Trading Indicators > Piercing Line and How to Use It for Market Top/Bottom Reversal in Trading
Expand Your Knowledge in This Area
Trading Indicators
Pivot Points: How to Identify Support and Resistance Levels
Trading Indicators
What Is Price Action? A Basic Guide to Understanding This Method
Trading Indicators
Analysis and Trading with the Cup and Handle Pattern
Trading Indicators
Popular Moving Averages and How to Choose the Best One for Your Strategy
Trading Indicators
Mastering the Market with the Evening Star Candlestick Pattern
Trading Indicators
Harami Candlestick Pattern and How to Trade It for Maximum Profit