TABLE OF CONTENTS
- What is the Rectangle Pattern?
- Bullish Rectangle Pattern
- Bearish Rectangle Pattern
- Advantages of Trading with the Rectangle Pattern
- Guide to Trading with the Rectangle Pattern
- Real-Life Example of Trading with the Rectangle Pattern
- Contrary Viewpoint: Is the Rectangle Pattern Always Effective?
- Rectangle Patterns in Different Markets
- Real-World Example of Rectangle Patterns in the US Market
- The Importance of Volume
- Challenges in Trading Rectangle Patterns
Breakout trading always attracts the attention of traders due to its high potential risk/reward ratio that can yield significant profits. One of the ways to take advantage of a breakout strategy is by trading the rectangle pattern. This pattern, which forms when the price fluctuates between a defined support and resistance zone, provides an ideal opportunity for trades with tight stop-loss levels and distant take-profit targets.
What is the Rectangle Pattern?
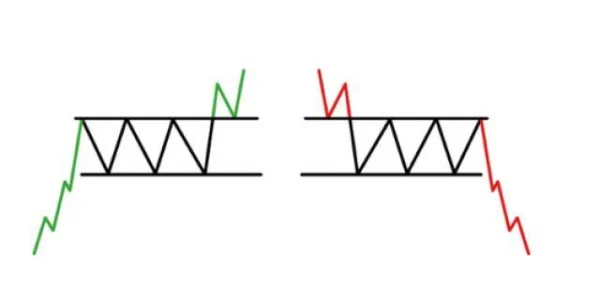
The rectangle pattern is a clear indication of a pause in the trend. When the price moves sideways between two parallel support and resistance lines, this pattern forms. It represents a consolidation phase, where the market tends to stabilize before continuing in the established direction.
Sometimes, rectangle patterns are not always easy to identify, and they do not always lead to a continuation of the trend. Some believe that the rectangle pattern may signal a reversal, especially when combined with other technical factors.

Bullish Rectangle Pattern
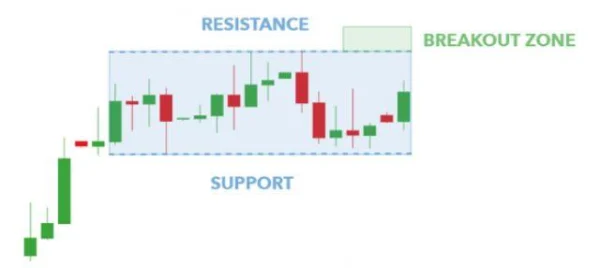
The bullish rectangle pattern forms when the market is in an uptrend. At this point, traders will look to open long positions when the price breaks above the top of the rectangle and closes within the breakout zone. This signals that the uptrend may continue.

Bearish Rectangle Pattern
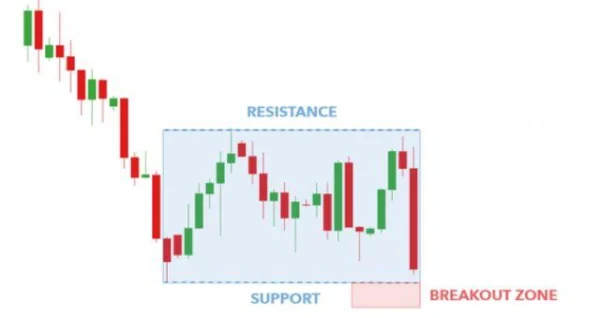
In contrast, the bearish rectangle pattern occurs when the price is in a downtrend. In this case, traders will look to open short positions when the price breaks below support and closes within the breakout zone. This indicates that the downtrend may continue.

Advantages of Trading with the Rectangle Pattern
The rectangle pattern has many advantages, which is why it is a popular choice among traders in breakout strategies. First, identifying support and resistance lines in this pattern is straightforward. These lines are key factors in making trading decisions.
Additionally, the rectangle pattern can be applied to various markets, from stocks and indices to other assets. Especially for new traders, recognizing an accumulation pattern in an established trend and then trading upon breakout is an easy-to-understand concept.
Another strength of this pattern is that entry points, stop-loss levels, and target levels are all very clear. This makes it easier for traders to manage risk and set reasonable trading strategies.
Tip: Never trade without confirming clear support and resistance levels. Especially before entering a breakout trade, ensure that the long-term trend is still intact.
Guide to Trading with the Rectangle Pattern
Trading with the rectangle pattern is fairly simple but requires traders to follow specific steps to achieve the highest effectiveness.
1. Identify the Previous Trend
Before drawing the rectangle pattern, the most important step is to clearly identify the prior trend. Is the market in an uptrend or downtrend? This is the basic step in making an informed trading decision.
2. Check for Larger Patterns
When analyzing the rectangle pattern, you also need to ensure that no larger patterns are forming, as this can affect the accuracy of the rectangle pattern.
3. Draw Support and Resistance Lines
Drawing the support and resistance lines is an essential step. You will need to connect the highs and lows in the rectangle pattern to identify key price levels.
4. Wait for the Price Breakout
After identifying the support and resistance lines, you need to wait for the price to break out. The price will break above or below the rectangle. When the candle closes above or below the support/resistance, you enter the trade.
5. Set the Price Target
The price target is calculated based on the height of the rectangle. This is one of the crucial factors in determining the desired profit when trading.
Real-Life Example of Trading with the Rectangle Pattern
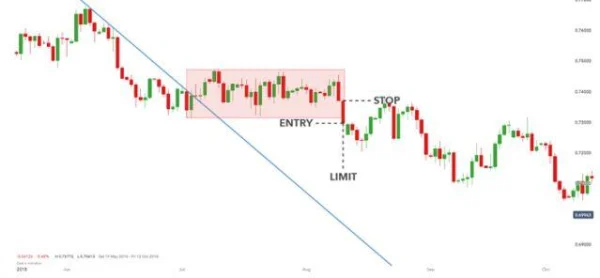
Let’s say you are trading the AUD/USD pair, and you notice a bearish rectangle pattern forming after a previous downtrend. This pattern is marked with a blue trendline. After the rectangle pattern forms, the price begins to fluctuate within the support and resistance limits (in red).
When the price breaks below support and closes beneath this level, you will enter a short position. The price target is calculated by measuring the height of the rectangle downwards, and the stop-loss is placed beyond the high of the breakout candle.
The risk/reward ratio in this trade is 1:2, meaning you accept the risk of one unit to potentially achieve two units of profit.

Trading with the rectangle pattern is a simple yet effective strategy. When understood and applied correctly, you can take advantage of breakout opportunities and minimize risks effectively.
Contrary Viewpoint: Is the Rectangle Pattern Always Effective?
Although the rectangle pattern is favored by many traders for its simplicity and ease in identifying support and resistance levels, there are some opposing views on its effectiveness. Some traders argue that this pattern does not always lead to a strong breakout, especially in markets lacking momentum or during consolidation phases.
For example, in the U.S. stock market during periods like 2022-2023, although many rectangle patterns formed, not all breakouts followed the predicted direction. In some cases, these patterns led to false breakouts, causing many traders to incur losses. This happens when a breakout candle moves beyond the pattern but then reverses and goes against the initial breakout direction.
Important tip: To reduce the risk of false breakouts, always confirm signals with other technical indicators like RSI, MACD, or long-term trendlines. If these indicators align with the breakout signal, the chances of a successful trade are higher.
Rectangle Patterns in Different Markets
The rectangle pattern is not only popular in stock trading but can also be applied to a wide range of assets, from market indices to individual stocks. However, the effectiveness of this pattern depends greatly on the type of market you are trading in.
For example, in the US stock market, when a rectangle pattern forms in the stocks of major tech companies like Apple or Microsoft, the likelihood of a breakout and continuation of the trend is very high. This is often due to the high liquidity of these stocks, which are less affected by external factors such as political news or macroeconomic changes.
On the other hand, in the stocks of smaller companies, or in unstable markets, the rectangle pattern may not perform as expected. Traders may face failures in breakout strategies, especially when the market is in a consolidation or correction phase.
Real-World Example of Rectangle Patterns in the US Market
During the 2020-2021 period, the US stock market saw numerous rectangle patterns, particularly in the stocks of technology companies. A notable example is Tesla (TSLA) stock, which formed a rectangle pattern after a strong uptrend.
In this case, traders would focus on the breakout above the top of the rectangle, as the overall market trend was bullish. After the candle closed above the resistance level, traders could open a buy position, and the price target would be determined by the height of the rectangle. As a result, Tesla stock continued its strong uptrend after the breakout, and those who entered the trade at the right time made significant profits.
However, in some cases, the rectangle pattern may not just indicate a breakout opportunity, but also a sign of consolidation before a potential trend reversal. A typical example is Amazon (AMZN) stock in 2019, which formed a rectangle pattern after a prolonged downtrend. Although the rectangle pattern seemed like a buying opportunity, after the price broke below support, the stock continued to decline, and without paying attention to other factors such as volume and technical indicators, traders could have faced losses.
The Importance of Volume
An important factor to note when trading with the rectangle pattern is volume. When a rectangle pattern forms, trading volume typically decreases throughout the consolidation phase. However, when the price breaks out of the pattern and volume increases, it is a strong signal indicating the continuation of the trend.
For instance, when Facebook (now Meta Platforms) broke out of a rectangle pattern in 2021, trading volume surged, which reinforced the breakout signal and confirmed the continuation of the uptrend. On the contrary, when volume is low and the price breaks out without confirmation from volume, the likelihood of a false break is very high.
Challenges in Trading Rectangle Patterns
Despite its simplicity, the rectangle pattern still presents challenges that traders must face. One of the biggest challenges is unpredictability when the pattern appears in a market with many strong influencing factors. Traders need to use supplementary tools such as technical indicators and multi-timeframe analysis to confirm signals.
It is important to identify the rectangle pattern within a clear trend and to be prepared for the possibility of a failed breakout. Some experts recommend viewing the rectangle pattern from the perspective of market psychology, especially during periods of high market volatility, such as during financial crises or significant macroeconomic events.
In all cases, whether in an uptrend or downtrend, it is crucial to be patient, confirm signals, and manage risk effectively.

DLMvn > Trading Indicators > How to Identify Rectangle Patterns in Trading
Expand Your Knowledge in This Area
Trading Indicators
Engulfing Pattern: A Reversal Signal in Technical Analysis
Trading Indicators
Decoding Overbought and Oversold Phenomena: What Do They Mean?
Trading Indicators
Trade Smarter with the Double Top Chart Pattern
Trading Indicators
Simple Trading Strategy with Support and Resistance
Trading Indicators
Harami Candlestick Pattern and How to Trade It for Maximum Profit
Trading Indicators
Evaluating the Dark Cloud Cover Candlestick Pattern: Opportunity or Trap for Investors?