Harmonic price patterns, a powerful tool in technical analysis, are often utilized by investors to identify potential price retracement points. These are not just theoretical methods but trusted “companions” of seasoned traders. DLMvn believes that understanding and correctly applying these patterns will provide a significant edge in identifying trading opportunities.
The ABCD Pattern
The ABCD pattern is considered simple yet extremely effective, particularly for those new to harmonic patterns. Its standout feature is its symmetrical structure, where AB and CD are two parallel legs, and BC is the corrective segment in between.
1. How to Identify the ABCD Pattern
Fibonacci tools are indispensable for identifying this pattern. When you place Fibonacci retracement on the AB leg, you’ll notice that BC typically retraces to the 61.8% level, while CD usually reaches the Fibonacci extension level of 127.2% relative to BC.
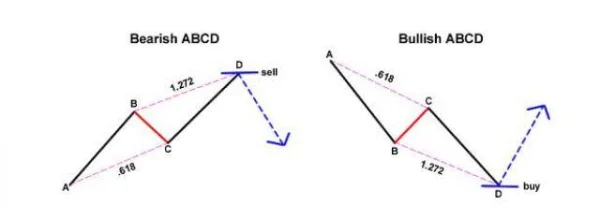
A brief anecdote to illustrate: in Vietnam’s stock market, HPG shares formed a textbook ABCD pattern in March 2022. After BC retraced precisely to the 61.8% level, the price surged at point D, delivering a profit of up to 12% within just two weeks.
2. Key Rules to Remember
- The length of AB must equal that of CD.
- The time taken to complete AB is nearly identical to that of CD.
- Avoid placing trades until point D is fully formed.
The Three-Drive Pattern
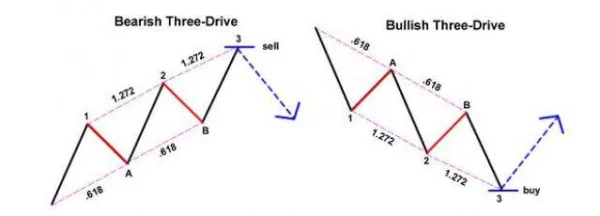
If you think the ABCD pattern is the pinnacle, the Three-Drive pattern will offer an entirely new perspective. Dubbed the “big brother” of ABCD, it includes an additional drive and corrective leg, forming three primary moves.
1. Core Characteristics
The Three-Drive pattern often appears during periods of significant market volatility, such as when the VN-Index reached its historic peak of 1,500 points at the end of 2021. In this pattern:
- The second drive retraces about 61.8% of the first drive.
- The third drive extends 127.2% or more relative to the previous correction.
2. Important Rules
- The time required to form each drive should be consistent.
- All corrections must adhere to the specified Fibonacci ratios.
The Gartley Pattern
The Gartley pattern, also known as the “222” pattern, is renowned as one of the most visually appealing and challenging patterns to identify. It combines the complexity of Fibonacci ratios with keen observational skills.
1. Unique Structure
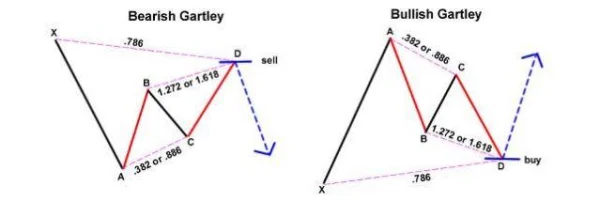
Unlike the ABCD pattern, the Gartley pattern begins with a significant trend (XA), followed by corrections, with the ABCD pattern nested within its structure. When observed in an uptrend, the Gartley resembles an “M,” while in a downtrend, it looks like a “W.”
A recent example from the international market is Tesla’s stock in early 2023. After a sharp decline, the price rebounded at key Fibonacci levels of the Gartley pattern, signaling a strong buying opportunity as the market hinted at a reversal.
2. Components of a Perfect Gartley Pattern
- AB retraces 61.8% of XA.
- BC falls within 38.2% to 88.6% of AB.
- CD equals 78.6% of XA or extends to a Fibonacci ratio relative to BC.
Do not rush into trades upon recognizing just part of a Gartley pattern. Be patient and wait for point D to form. For greater certainty, combine this with other technical indicators, such as RSI, to confirm reversal signals.
3. Challenges in Applying the Gartley Pattern
Identifying Fibonacci ratios in the Gartley pattern can sometimes overwhelm investors. A common mistake is incorrectly pinpointing points X or D, leading to poor trading decisions. A helpful tip is to focus on practicing with historical data before applying it in live markets.
Variations of the Gartley Pattern and Harmonic Trading Strategies
Harmonic patterns are not limited to the Gartley but include various other variations, offering unique trading opportunities. Below are some popular variations that DLMvn recommends exploring to maximize their potential.
The Crab Pattern
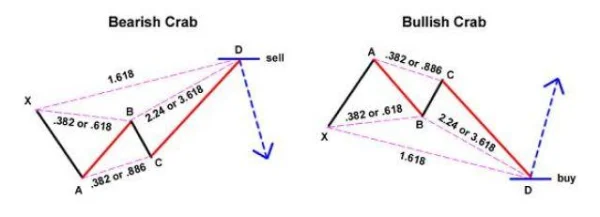
The Crab pattern, introduced by Scott Carney in 2000, is one of the most rewarding patterns in terms of risk-reward ratio. Its standout feature is the ability to set tight stop-loss levels, minimizing risks.
Fibonacci Ratios in the Crab Pattern
- AB equals 38.2% or 61.8% of XA.
- BC retraces 38.2% or 88.6% of AB.
- If BC retraces 38.2% of AB, CD extends to 224% of BC. Conversely, if BC retraces 88.6%, CD extends to 361.8% of BC.
- CD extends 161.8% of XA.
DLMvn observed a clear Crab pattern in VNM stock in 2021. After the price hit the Fibonacci extension level of 161.8% of XA, the stock surged, yielding over 10% profit within a week.
The Bat Pattern
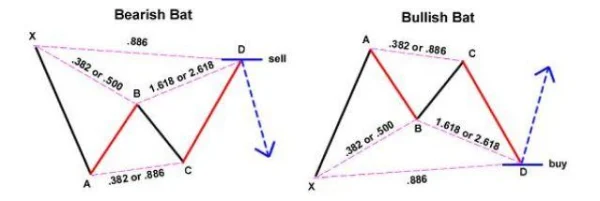
The Bat pattern, another discovery by Scott Carney, has a structure similar to Gartley but with refined Fibonacci ratios, offering more precise reversal points.
Fibonacci Ratios in the Bat Pattern
- AB retraces 38.2% or 50% of XA.
- BC retraces 38.2% or 88.6% of AB.
- If BC retraces 38.2% of AB, CD extends to 161.8% of BC. If BC retraces 88.6%, CD extends to 261.8% of BC.
- CD equals 88.6% of XA.
An example is MWG stock during 2019-2020. When a Bat pattern appeared in an uptrend, the price retraced precisely to the Fibonacci level of 88.6%, then surged and reached a new peak.
The Butterfly Pattern
Developed by Bryce Gilmore, the Butterfly pattern is characterized by a deeper AB retracement of XA compared to other patterns.

Fibonacci Ratios in the Butterfly Pattern
- AB equals 78.6% of XA.
- BC retraces 38.2% or 88.6% of AB.
- If BC retraces 38.2% of AB, CD extends to 161.8% of BC. If BC retraces 88.6%, CD extends to 261.8% of BC.
- CD equals 127% or 161.8% of XA.
The Butterfly pattern often emerges when markets reach critical peaks or troughs. A notable example is VIC stock in 2022, where this pattern precisely identified a reversal point at the Fibonacci extension of 127% of XA.
Trading Strategies with Harmonic Patterns
The success of harmonic pattern-based trades heavily relies on accurately identifying the pattern. Here are the basic steps to apply this strategy.
Step 1: Identify Potential Harmonic Patterns
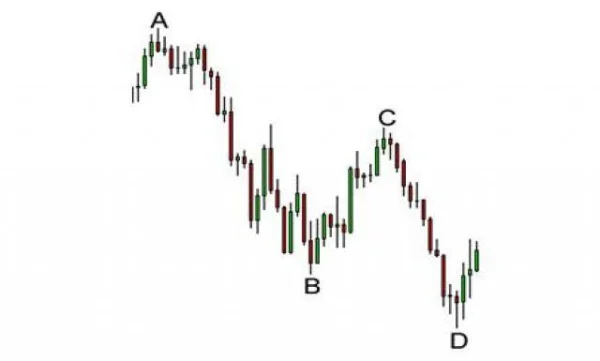
Start by identifying potential pivot points. Look for structures on a price chart that might match one of the harmonic patterns.
Step 2: Use Fibonacci Tools
Fibonacci tools are indispensable for measuring wave ratios and matching them to harmonic patterns.

- For example: If BC retraces 61.8% of AB and CD extends to 127.2% of BC, it is likely an ABCD pattern.
Step 3: Execute Trades
When the pattern completes, place buy or sell orders at point D. To minimize risk, set stop-loss orders just below (or above) point D.
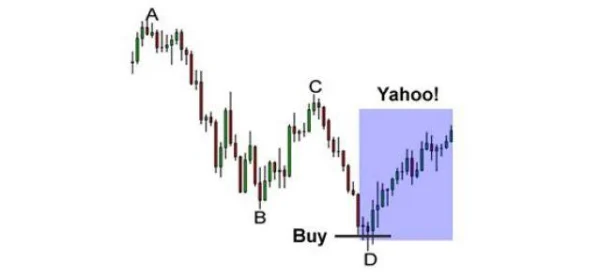
Patience is key. Avoid rushing into trades before the pattern fully completes. Focus on observation and wait for market confirmation.
Deeper Aspects of Harmonic Price Patterns
Why Are Harmonic Patterns Effective?
One of the primary reasons harmonic patterns are widely used by traders is their ability to accurately predict reversal points based on market psychology. These patterns rely on the theory that price movements are not random but adhere to specific rules reflected through Fibonacci ratios.
Imagine tracking VHM stock in a downtrend. When the price reaches the Fibonacci extension of 161.8%, you may notice capital inflows starting to increase. This is not a coincidence but rather a signal that large institutions are taking advantage of the attractive price levels, triggering a market shift.
Challenges in Applying Harmonic Patterns
Despite their accuracy, harmonic patterns are not always easy to implement.
1. Complexity in Identification
Identifying a harmonic pattern demands experience and keen observation. Markets don’t always form “perfect” patterns, and sometimes, Fibonacci ratios may only approximate the ideal levels, making recognition challenging.
Advice: Beginners can consider using tools like the Auto Harmonic Pattern Indicator available on trading platforms. However, it’s crucial not to rely entirely on such tools, as they often perform best in stable market conditions.
2. Time Factors
The time required for a pattern to form is another critical aspect often overlooked. Patterns that develop either too quickly or too slowly may not be reliable.
Example: If you’re monitoring a Bat pattern on HPG stock and notice that the BC leg takes significantly longer than expected to form, this might indicate instability. Proceed with caution before placing trades.
Harmonic Patterns in the Context of Vietnam’s Stock Market
Vietnam’s stock market has unique characteristics, with retail investors playing a dominant role. This often makes harmonic patterns more effective, as strong herd behavior and significant reactions to Fibonacci levels are commonly observed.
Mid-cap stocks are frequently more likely to form harmonic patterns than large-cap stocks. This is because mid-cap stocks generally exhibit clearer price fluctuations, making it easier to identify pivot points for pattern recognition.
Suggestions for Developing Trading Strategies
1. Integrating Harmonic Patterns with Other Tools
To enhance reliability, you can combine harmonic patterns with other technical indicators like RSI or MACD.
Example: When an ABCD pattern completes at point D, and the RSI crosses above the oversold level (30), the likelihood of a price increase becomes much higher.
2. Monitoring Liquidity
Liquidity is an essential factor when trading harmonic patterns. A completed pattern without an accompanying surge in volume often yields subpar results.
Tip: To assess liquidity, observe the trading volume at pivot points. High volume at point D often signals a strong reversal.
The Role of Discipline and Patience
A successful harmonic trader requires not only knowledge but also patience. The market doesn’t produce perfect patterns every day. You need to wait and only enter trades when a pattern is fully validated.
A memorable story from DLMvn involves monitoring FPT stock. After weeks without any significant signals, a perfect Butterfly pattern emerged at the Fibonacci level of 127%. As a result, the stock rose by 12% within two weeks, underscoring the importance of patience.
Harmonic patterns are not just technical tools but also lessons in discipline, patience, and meticulous market analysis.

DLMvn > Trading Indicators > How to Effectively Use Harmonic Price Patterns in Trading and Investing
Expand Your Knowledge in This Area
Trading Indicators
Streamlining Strategies: Mastering RSI to Maximize Profits
Trading Indicators
Harami Candlestick Pattern and How to Trade It for Maximum Profit
Trading Indicators
Trading with Bollinger Bandwidth: Identifying Accurate Entry Points
Trading Indicators
Hanging Man: A Reversal Candlestick Pattern
Trading Indicators
How to Identify Trendlines in Trading
Trading Indicators
Mastering the Market with the Evening Star Candlestick Pattern