TABLE OF CONTENTS
- Harami Candlestick Pattern and Market Psychology
- Bullish Harami and Market Reversal Opportunity
- Bearish Harami and Market Decline Opportunity
- Trading Experience with the Harami Candlestick Pattern
- Advantages and Disadvantages of the Harami Candlestick Pattern
- A Deep Dive into the Harami Candlestick Pattern in Trading
- The Harami Candlestick Pattern: Investor Uncertainty in Decision-Making
- The Importance of Confirmation Indicators
- Challenges in Trading the Harami Candlestick Pattern
- The Harami Candlestick Pattern Is Not Always Reliable
- Seizing Market Opportunities with Harami
Harami Candlestick Pattern and Market Psychology
The Harami candlestick pattern, a term derived from Japanese, means “pregnant woman.” In reality, “Harami” is not just a candlestick pattern; it is a powerful signal that reflects the hesitation of investors in the market. The pattern consists of two candles, with the second candle (the “child”) entirely contained within the range of the first candle (the “mother”). This contrast creates unique opportunities and challenges in identifying potential trend reversals.
I remember the first time I saw a Bullish Harami appear during a downtrend in the U.S. stock market. It was a time when many investors were skeptical about a market recovery, but this candlestick pattern clearly indicated an opportunity, a sign of a reversal. The beauty of the Harami pattern lies in its ability to signal a shift in market psychology, where prices may become “locked” within a narrow range, awaiting a decision.
Bullish Harami and Market Reversal Opportunity
Bullish Harami: A Bullish Signal
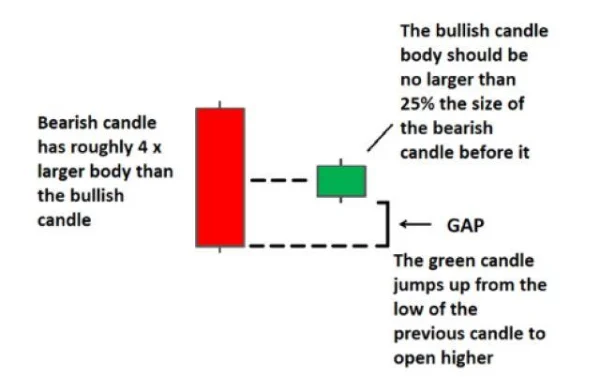
The Bullish Harami pattern often appears at the bottom of a downtrend, signaling the potential for a reversal and price increase. The first candle is a large bearish candle, and the second is a small bullish candle entirely within the range of the first candle. This reminds me of an Inside Bar, a smaller candlestick pattern surrounded by a larger one.

When a Bullish Harami appears, technical indicators like RSI and MACD show a slowdown in the downtrend. At this point, combining these with momentum indicators like Stochastic can help confirm the signal. However, the key is that the second candle (the bullish one) should not exceed 25% of the length of the first candle, ensuring that the signal is strong and reliable.
How to Identify a Bullish Harami
To identify a Bullish Harami, you first need to determine that the current market trend is bearish. Momentum indicators should show weakening or even signal a reversal. For example, if the RSI is showing an oversold signal or moving averages are crossing, you may consider entering a buy position.
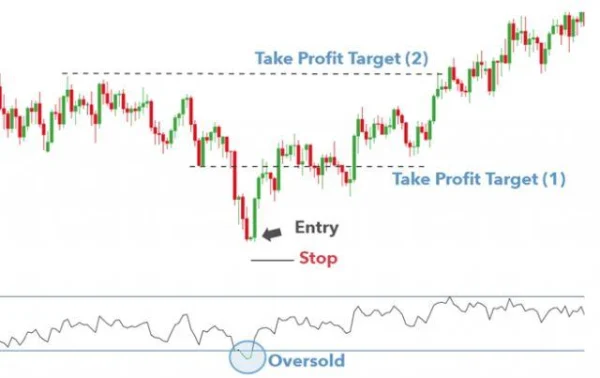
Once a Bullish Harami forms, traders can enter a buy order immediately after the candle completes and the reversal signal is confirmed. This requires patience and a combination of technical analysis elements, from RSI indicators to support levels. Additionally, stop loss points should be set below the new low to limit risk if the market does not behave as expected.
Bearish Harami and Market Decline Opportunity
Bearish Harami: A Bearish Signal
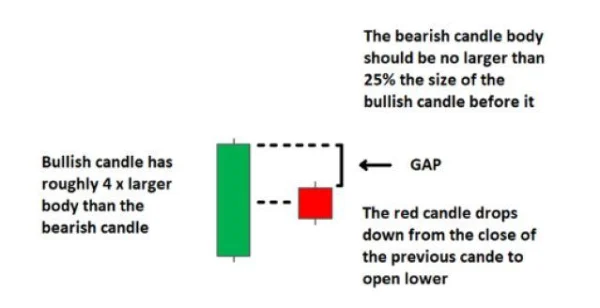
In contrast to the Bullish Harami, the Bearish Harami pattern typically appears at the top of an uptrend, signaling a potential reversal and price decline. The first candle is a large bullish candle, followed by a small bearish candle entirely contained within the range of the first candle. This is a signal that reflects the weakening of the uptrend.

If you look at the U.S. stock market during periods of “saturation,” you’ll see that the Bearish Harami is not just a candlestick pattern. It reflects the anxiety of investors, where indecision becomes a clear signal for a downtrend. At this point, the RSI indicator typically shows that the market is overbought and that the momentum of the price increase is clearly weakening.
How to Identify a Bearish Harami
To identify a Bearish Harami, you need to note that the current market trend is bullish, but momentum indicators like RSI or MACD are signaling weakness. The second bearish candle in this pattern should have a small body and should not exceed 25% of the length of the previous bullish candle. Moreover, the bearish candle should be entirely within the range of the preceding bullish candle.
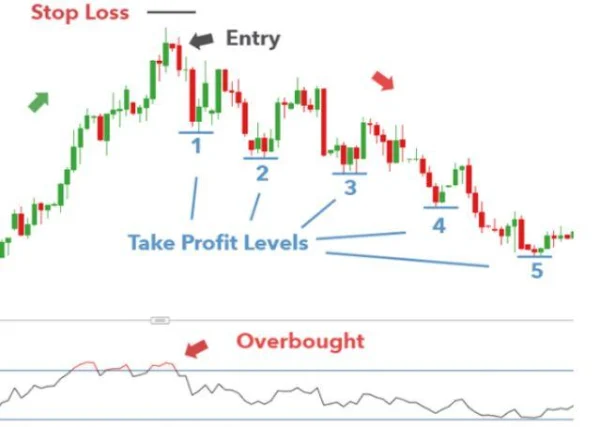
Once the Bearish Harami is complete, traders can enter a sell order, with a stop loss set above the new high. Profit targets can be set at support levels, where the downtrend may start to gain more momentum. Again, it is important to combine this with indicators and support levels to increase the reliability of the signal.
Trading Experience with the Harami Candlestick Pattern
How to Trade with a Bullish Harami
Looking at the GBP/USD chart, you will see a clear downtrend followed by a complete Bullish Harami. Before the Bullish Harami appears, a Bullish Hammer appears as a signal preparing for a reversal. The second candle in this Harami pattern has a body that is no more than 25% of the first candle, and the entire bullish candle is contained within the range of the preceding bearish candle.

At this point, RSI indicates that the market is oversold, but I recommend waiting for RSI to cross above the 30 level to confirm the signal before entering the trade. Stop loss points can be set below the new low, and traders can set profit targets at support and resistance levels. This method requires patience and confirmation from various technical factors.
How to Trade with a Bearish Harami
In contrast, on the USD/SGD chart, you will see a strong uptrend, but when the Bearish Harami appears, everything begins to change. The RSI indicator shows that the market is overbought, and once the bearish candle completes, you can enter a sell order. However, do not rush – wait for RSI to cross below the 70 level to confirm the reversal.

Stop loss points can be set above the new high, and profit targets can be set at support levels in the downtrend. At this point, the Bearish Harami will open opportunities for investors to capitalize on a strong price correction.
Advantages and Disadvantages of the Harami Candlestick Pattern
Advantages of the Harami Candlestick Pattern
The Harami is easy to identify and can create trading opportunities with an attractive risk/reward ratio. Many traders have leveraged this candlestick pattern to identify reversal opportunities and earn profits. Using the Harami in trading also helps you filter out precise signals from a range of technical factors.
Disadvantages of the Harami Candlestick Pattern
However, the Harami is not a “magic” tool that you can use independently. Trading solely based on this pattern can be risky, as you still need additional confirmation signals from indicators and other factors in technical analysis. Failing to combine with confirmation tools can lead to false signals or false breakouts, causing losses.
When trading with the Harami candlestick pattern, never overlook the combination with other indicators like RSI, MACD, or support and resistance levels. This is the key to maximizing profits and minimizing risks in every trade.
A Deep Dive into the Harami Candlestick Pattern in Trading
The Harami candlestick pattern, although quite simple and easy to identify, contains deeply significant psychological elements of the market. The “hesitation” signals within this pattern – two candles with contrasting sizes and colors – reflect the confusion and indecision of investors. If you look closely, Harami signals that the market is entering a transitional phase, where participants begin to doubt the current trend. However, this does not mean that Harami is always a reliable reversal signal. Often, it may just indicate a temporary pause or a “pullback” within a larger trend.
The Harami Candlestick Pattern: Investor Uncertainty in Decision-Making
Looking at examples from global stock markets, it becomes clear that the formation of the Harami candlestick pattern does not always lead to a sharp reversal trend. A typical example is the U.S. stock market during the 2008-2009 period. During the financial crisis, many Harami candlesticks appeared, but not all of them signaled a strong bullish trend. Often, after a Bullish Harami appeared, the market continued to decline before actually beginning to recover.
This raises the question: Is the Harami candlestick pattern truly reliable? The answer is not simple. As mentioned earlier, this pattern might simply reflect hesitation in the minds of investors. Yet, this very hesitation is what allows traders to “read” the market and spot signs of a major shift.
The Importance of Confirmation Indicators
Because the Harami candlestick pattern is inherently uncertain, traders must always combine it with other indicators for confirmation. One key indicator I always use when trading with this pattern is the RSI (Relative Strength Index). RSI helps you gain a clearer view of the market’s condition, such as when the market is overbought or oversold. If RSI shows an oversold signal (e.g., below 30) and a Bullish Harami forms, it could be a significant signal.
However, the RSI indicator is not always 100% accurate. A notable example is the global stock market in 2018, where the RSI indicators showed the market was oversold, but the market continued to decline before a real recovery began. Therefore, relying solely on RSI for trade entry would be a grave mistake. This reminds us that no indicator is perfect. To trade effectively, you must combine multiple technical analysis factors, not rely on just one signal.
Challenges in Trading the Harami Candlestick Pattern
One of the major challenges when trading the Harami candlestick pattern is the uncertainty in its signals. While a Bullish Harami can indicate a reversal in a downtrend, it does not always yield the expected result. Similarly, a Bearish Harami does not always signal a strong bearish move in an uptrend.
Take the U.S. stock market from 2015 to 2016 as an example, when many Bearish Harami patterns appeared in the upward trend of the S&P 500 index. However, after each Bearish Harami formed, the market continued to grow strongly. This is a prime example of the weakness of this pattern when used alone, without strong confirmation signals.
The Harami Candlestick Pattern Is Not Always Reliable
While the Harami candlestick pattern is considered a powerful tool in technical analysis, I must offer a counterpoint: This pattern can easily be “misused” by inexperienced traders. Harami is a relatively easy pattern to identify, but sometimes its simplicity causes traders to rush into trades without carefully confirming other market factors.
A study by Valueline Securities Research in 2017 found that trading solely based on the Harami candlestick pattern, without confirmation from other indicators, resulted in a success rate of only around 50-55%. This highlights an important point: The Harami candlestick pattern is truly valuable when combined with other technical analysis tools, such as support/resistance levels, momentum indicators, and other candlestick patterns.
Seizing Market Opportunities with Harami
Once you fully understand the nature and limitations of the Harami candlestick pattern, using it to find trading opportunities becomes more effective. I often apply Harami in short-term trading strategies during market corrections. Traders can enter a buy position when a Bullish Harami appears in a downtrend and set profit targets at nearby support levels. Similarly, when a Bearish Harami appears in an uptrend, traders can enter a sell position and take profits at resistance levels.

DLMvn > Trading Indicators > Harami Candlestick Pattern and How to Trade It for Maximum Profit
Expand Your Knowledge in This Area
Trading Indicators
10 Candlestick Patterns Every Trader Should Know
Trading Indicators
Discovering Elliott Wave Theory: The Foundation of Market Forecasting Art
Trading Indicators
Essential Knowledge For Trading With Price Channels
Trading Indicators
Mastering the Morning Star Candlestick to Conquer the Market
Trading Indicators
Profiting from the Morning Doji Star Candlestick Pattern
Trading Indicators
Exploring the Relationship Between Bollinger Bands and MACD