TABLE OF CONTENTS
- What is the Hanging Man Candlestick?
- Characteristics of the Hanging Man Candlestick
- Trading Signals with the Hanging Man Candlestick
- Applying the Hanging Man Pattern in Trading
- Frequently Asked Questions When Using the Hanging Man Candlestick Pattern
- The Importance of the Hanging Man Candlestick Pattern
- The Relationship Between the Hanging Man Pattern and Market Sentiment
- Other Factors Affecting the Effectiveness of the Hanging Man Pattern
- How to Maintain Profits with the Hanging Man Pattern
- Contrarian Views on the Hanging Man Pattern
- Practical Advice
The Hanging Man candlestick pattern is perhaps one of the most haunting patterns in trading. A terrifying name, yet it holds signals that cannot be ignored by experienced traders.
Anyone who has traded stocks knows the excitement of seeing prices rise in a strong uptrend, reaching a peak. However, this euphoria does not last forever. As the saying goes, “All good things must come to an end.” And in the financial market, this end often comes unexpectedly, leading to sharp price declines. Therefore, it is important to recognize signs of reversal to manage risk in a timely manner.

In this article, DLMvn will explore the Hanging Man reversal candlestick pattern and how to apply it to increase profits in trading.
What is the Hanging Man Candlestick?
The Hanging Man candlestick (also known as “the hanging man”) reflects strong selling pressure that appears at the peak of an uptrend. When prices rise high and reach their peak, traders notice a change in market sentiment, with the “sellers” overpowering the “buyers.” The name “Hanging Man” was not chosen randomly; it symbolizes a warning of a potential reversal when the market could unexpectedly turn.
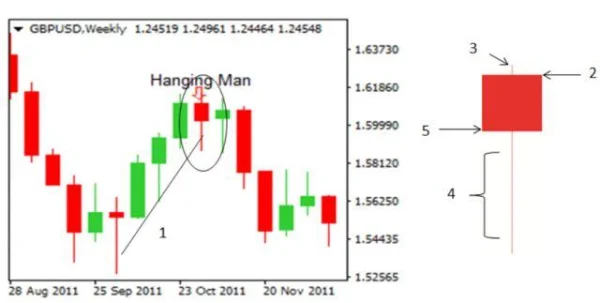
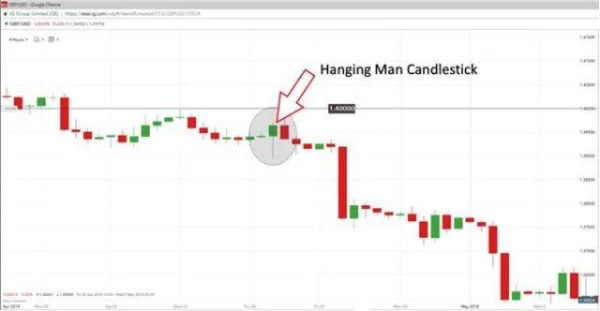
This can be clearly seen in the GBP/USD exchange rate chart below, where a red candlestick appears at the top of an uptrend, indicating that selling pressure has emerged and the market is beginning to weaken.

Characteristics of the Hanging Man Candlestick
The Hanging Man candlestick has several recognizable features:
- Small body: The body of the candlestick is quite narrow, indicating that buying and selling pressures are almost equal throughout the trading session, but price movement has started to slow down.
- Short or no upper wick: This indicates that although there was a strong effort to maintain the uptrend, it was unsuccessful.
- Long lower wick: This is the distinctive feature of the Hanging Man pattern. The long lower wick indicates strong selling pressure, which pushes the price down before the “buyers” try to recover some of the losses. However, this recovery is not strong enough to prevent further price decline.
- Closing price lower than opening price: If the closing price is lower than the opening price, it signals that the strength of the downtrend is beginning to appear.
Trading Signals with the Hanging Man Candlestick
The Hanging Man candlestick can be used as a signal to confirm a sell trade, also known as a bearish trade. The long lower wick is a sign of a major sell-off, paving the way for a strong downtrend. However, the confirmation of this pattern does not depend solely on the formation of the Hanging Man candlestick but also on the price action that follows.
- If the next candlestick falls below the low of the Hanging Man candlestick, it can be a strong signal for a new downtrend.
- The market may continue to decline, creating an ideal entry point if the price breaks through the short-term uptrend line.
Applying the Hanging Man Pattern in Trading
To apply the Hanging Man pattern effectively, understanding its correlation with the long-term trend is crucial. Multi-timeframe analysis will help you do this more easily.
1. Identifying the Long-Term Trend
The first step is to look at the chart on a longer timeframe, such as D1 or W1, to identify the primary market trend. Once the long-term trend is clear, you can more easily spot reversal points when the market shows signs of changing.
2. Identifying the Ideal Entry Point
Using shorter timeframes (such as H4, H2) will help you spot more specific trading opportunities. After the Hanging Man candlestick appears at the top of an uptrend, you need to find an exact entry point when indicators and price patterns provide clear signals.
3. Using Supporting Indicators
Don’t forget to use technical indicators to confirm the downtrend. For example:
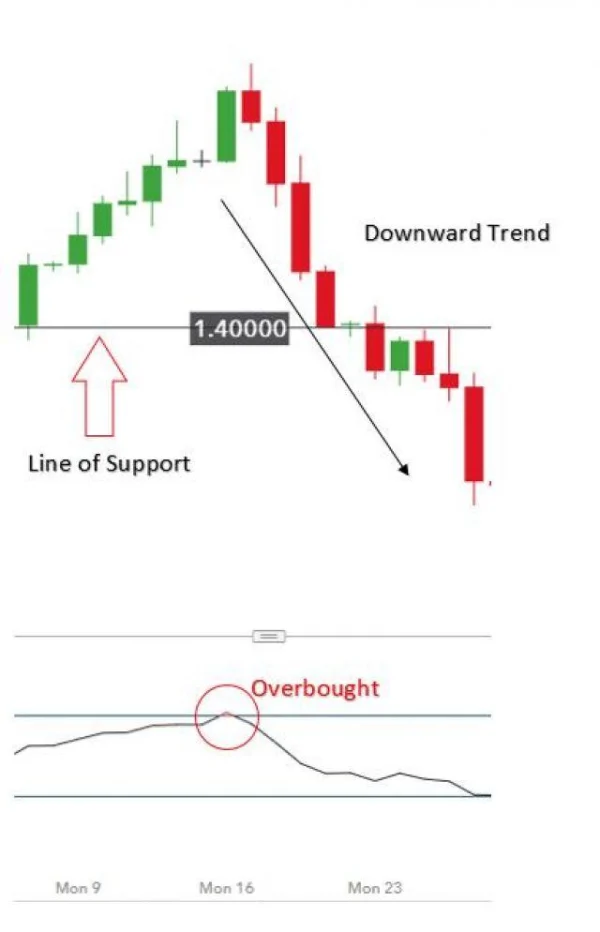
- RSI can indicate if the market is overbought and about to reverse.
- SMA (Simple Moving Average) can show crossovers between moving averages, suggesting the market might shift to a downtrend.
- Fibonacci retracement can help you find key support and resistance levels where price could reverse.
4. Executing the Trade
The ideal entry point is at the low of the Hanging Man candlestick. If the market continues to decline afterward, you can enter a sell trade with a reasonable profit target.
5. Managing Risk
Make sure to manage your risk by setting a maximum risk level for each trade. Each trade should not risk more than 5% of your total account. Also, don’t forget to place a stop loss at the highest point of the Hanging Man candlestick to protect your account.
6. When to Close the Trade?
One of the most important strategies in trading is the Risk/Reward ratio. The ideal ratio is 1:2, meaning the profit you expect should be double the loss you can tolerate. Applying this strategy will help you achieve long-term success in trading.


Confirming the Sell Signal:
- The market has a long-term downtrend.
- The Hanging Man candlestick appears at the top of a short-term uptrend.
- Key support and resistance levels.
- The next candlestick moves below the low of the Hanging Man.
Frequently Asked Questions When Using the Hanging Man Candlestick Pattern
Where can I find the Hanging Man pattern in the markets?
The Hanging Man candlestick pattern can appear in all markets. With an average daily trading volume exceeding $5 trillion, it provides great opportunities for traders seeking strong candlestick signals like the Hanging Man.
How can I effectively identify support and resistance levels?
Support and resistance levels are important price levels that the market has tested in the past but has not broken. Accurately identifying them requires special attention and technical analysis skills, as they are key factors in determining market reversals.
The Importance of the Hanging Man Candlestick Pattern
The Hanging Man candlestick, like a warning about uncertainty, appears when an uptrend has peaked, and the likelihood of a correction or reversal is high. However, this pattern is not always 100% accurate. Contrary to these warnings, there may be cases where the Hanging Man does not immediately lead to a reversal but simply marks a pause in the uptrend.
A real example from the US stock market: Between 2017 and 2018, the S&P 500 index saw multiple occurrences of the Hanging Man pattern during strong rallies, but not all of them immediately led to a reversal. Although the Hanging Man often appears near key resistance levels, the market continued to rise for a while before experiencing a sharp decline.
One reason why this pattern may sometimes be inaccurate is that the market is in a strong trend, and other factors may influence price action. Therefore, recognizing the Hanging Man should be accompanied by a thorough analysis of external factors such as macroeconomic indicators, political situations, and factors affecting market sentiment.
The Relationship Between the Hanging Man Pattern and Market Sentiment
What makes the Hanging Man pattern unique is the dramatic change in market sentiment when this candlestick appears. Typically, when prices continue to rise for an extended period, investors become overconfident, and the market begins to lack buying pressure. However, the appearance of the Hanging Man candlestick shows that the determination of the buyers is starting to weaken.
A notable study from Nielsen, a global market research company, shows a direct correlation between “buying at the top” sentiment and the appearance of reversal patterns like the Hanging Man. 58% of US investors in the 2016-2017 period reported frequently “ignoring” warning signals when the market was in a strong uptrend, leading to irrational trading decisions. Therefore, correctly identifying the signals of the Hanging Man pattern can help traders avoid “buying the top” at excessively high price levels.
Other Factors Affecting the Effectiveness of the Hanging Man Pattern
DLMvn wants you to know that the Hanging Man candlestick doesn’t always lead to a sharp downtrend. In some cases, the market may continue to rise after this candlestick appears, if other factors such as technical indicators, macroeconomic information, or market psychology still support the positive trend.
For instance, in late 2019, when U.S. stock markets hit record highs, indices like Dow Jones and Nasdaq showed the Hanging Man pattern. However, thanks to the Federal Reserve’s loose monetary policies and economic stimulus packages, the market continued to rise, despite the Hanging Man warning of a potential reversal. This shows that the appearance of the Hanging Man doesn’t always signal a sharp drop if macroeconomic factors support the market.
How to Maintain Profits with the Hanging Man Pattern
Another important point DLMvn wants to emphasize is that you should not rely solely on the Hanging Man pattern and ignore other supporting tools. The combination of various technical indicators and multi-timeframe analysis will help increase your chances of a successful trade.
Experience from Global Stock Markets
One of the key lessons in trading is not to make decisions based on just one candlestick pattern. Consider using other indicators such as RSI (Relative Strength Index), MACD (Moving Average Convergence Divergence), or Fibonacci retracement to see if the market reacts as expected after the Hanging Man candlestick appears.
For example, in the U.S. stock market in 2020, when the Hanging Man candlestick appeared on Tesla Inc.‘s chart, many traders rushed to sell thinking the price would drop sharply. However, by using the RSI indicator, they found that it had not yet crossed above 70, meaning the market was still in an overbought condition. This helped them avoid hasty decisions and continue holding their buy positions.
Contrarian Views on the Hanging Man Pattern
A contrarian view that you need to consider is that sometimes the Hanging Man pattern may only be a “small correction” in a long-term uptrend, rather than a major reversal. In the global stock market, especially in strong stocks like Apple, Amazon, or Microsoft, the appearance of the Hanging Man does not necessarily lead to an immediate price drop. These stocks often have exceptional strength and can maintain the uptrend even when this pattern appears.
For example, in 2021, Amazon stock showed the Hanging Man pattern after a strong rally, but the market continued to rise for a while before a major correction occurred. This shows that large-cap stocks with strong fundamentals and robust cash flows can “resist” the signal from the Hanging Man pattern.
Practical Advice
In practice, no candlestick pattern can guarantee absolute accuracy. To increase the success rate of trading with the Hanging Man pattern, you should:
- Apply a diversified strategy: Don’t rely solely on one candlestick pattern. Combining multiple technical analysis tools and macroeconomic information will help you make more informed trading decisions.
- Ensure proper risk management: Risk management is the most important factor when using this pattern. Never neglect stop-loss and take-profit levels to protect your account from unforeseen reversals.
By applying the Hanging Man pattern strictly and flexibly, you will gain a better understanding of the market, make informed trading decisions, maximize profits, and minimize risks.

DLMvn > Trading Indicators > Hanging Man: A Reversal Candlestick Pattern
Expand Your Knowledge in This Area
Trading Indicators
Double Bottom Pattern Signals an Uptrend
Trading Indicators
What Is Price Action? A Basic Guide to Understanding This Method
Trading Indicators
How to Identify and Trade Hammer Candlesticks on Charts
Trading Indicators
Three Inside & Outside Up Candlestick Patterns: Bullish Reversal Signals
Trading Indicators
Essential Knowledge for Interpreting Divergence Signals
Trading Indicators
Piercing Line and How to Use It for Market Top/Bottom Reversal in Trading