Insights From An Expert’s Perspective
DLMvn once pondered a crucial question: “Is there a method to trade more effectively while minimizing risks?” In reality, there is a straightforward yet highly promising approach: divergence in technical analysis. This method not only helps you pinpoint entry points near market bottoms or exits near tops but also detects potential trend reversals to optimize trade exits.
Divergence occurs when price movements deviate from technical indicators such as RSI, MACD, Stochastic, or CCI. What’s fascinating here is that divergence acts as a leading market indicator. When applied correctly, it can generate consistent profits while significantly reducing risks.
Let’s explore this technique through detailed analysis and practical examples with DLMvn.
Fundamental Rule: “Higher Highs and Lower Lows”
In the financial market, price and momentum typically move “in sync,” much like the duo Batman and Robin. When prices create higher highs, technical indicators often follow suit. Conversely, when prices make lower lows, indicators usually confirm with similar movements.
However, when this rule breaks – prices and indicators head in different directions – a divergence signal emerges. This signals that the market may be poised for a significant shift. Divergence not only helps you identify weakening trends but also assists in recognizing potential reversals or trend continuations.
1. Regular Divergence
Regular divergence is used to identify possible trend reversals. There are two main types:
Bullish Divergence
When prices make lower lows (LL – Lower Lows), but technical indicators create higher lows (HL – Higher Lows), this indicates bullish divergence. This signal often appears at the end of a downtrend.
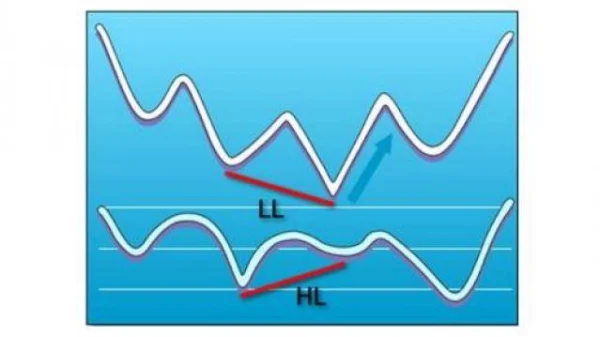
For instance, if a stock price consistently declines and forms two consecutive lows while the RSI rises, it’s a clear indication that bearish momentum is weakening, and prices may rebound.
Bearish Divergence
Conversely, when prices create higher highs (HH – Higher Highs), but technical indicators show lower highs (LH – Lower Highs), this signals bearish divergence. It often appears during an uptrend, indicating the potential for a price reversal.
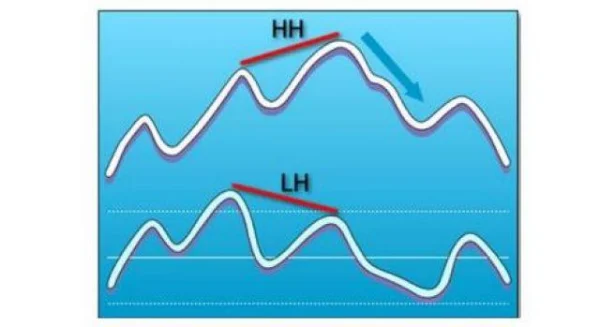
For example, if the MACD fails to keep pace with new price highs, it indicates waning bullish momentum, prompting you to consider taking profits.
Pay close attention to indicators combined with trading volume. Bearish divergence coupled with lower volumes often signals a robust reversal.
2. Hidden Divergence
Unlike regular divergence, hidden divergence is employed to identify potential trend continuations.
Bullish Divergence
In an uptrend, if prices create higher lows (HL – Higher Lows), but indicators form lower lows (LL – Lower Lows), this suggests the uptrend still has strength.
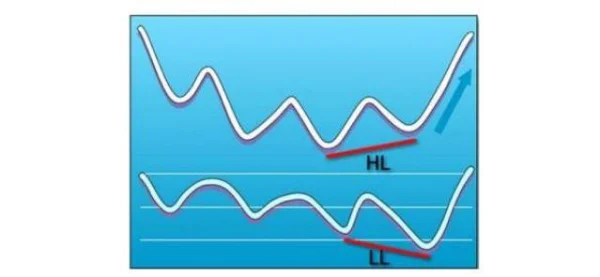
Bearish Divergence
Similarly, in a downtrend, if prices form lower highs (LH – Lower Highs), but indicators create higher highs (HH – Higher Highs), this confirms the continuation of the downtrend.
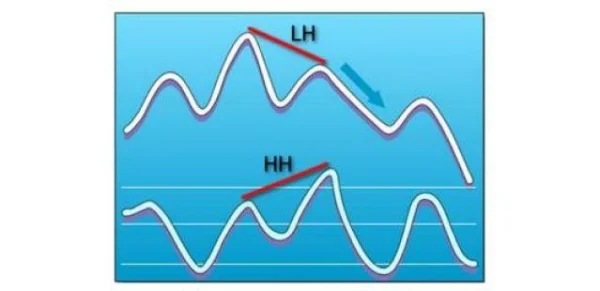
Combining hidden divergence with trendlines and support/resistance zones enhances trading accuracy.
The Importance of Understanding Divergence Signals
Divergence is an indispensable tool in any investor’s toolkit. It not only aids in identifying reversal points but also plays a critical role in risk management. Developing the skill to quickly recognize divergence allows you to make well-informed decisions.
Remember, momentum shifts always precede price changes. Divergence offers the opportunity to “read” these signals ahead of most market participants.
Trading With Divergence: Practical Scenarios
1. Bullish Hidden Divergence Signal
Consider the following daily chart. When prices continue to drop, forming lower lows, but the Stochastic indicator creates higher lows, it’s a clear sign of bullish hidden divergence. Could this be an opportunity to enter a long position?
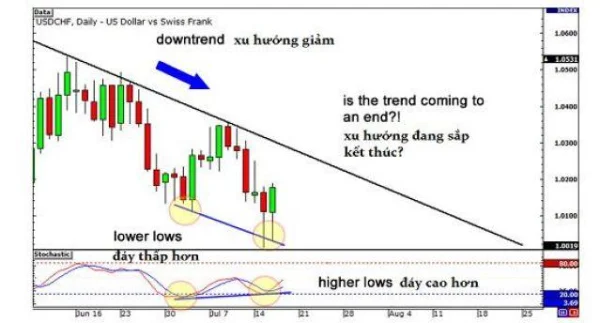
Result: Prices promptly reverse, breaking the downtrend line. A robust uptrend follows. Entering near the bottom not only yields profits but also presents an opportunity to ride the trend for significant gains in the coming months.
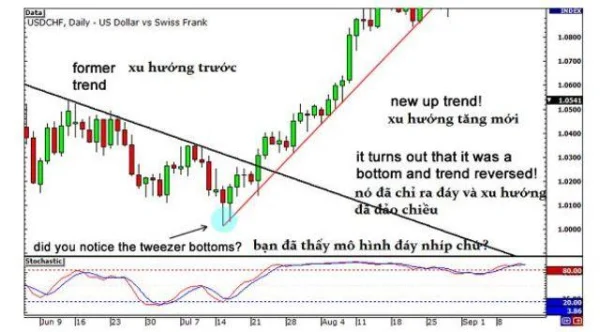
Notably, the Double Bottom candlestick pattern (tweezer bottom) appears as prices form the second low. The combination of divergence and this pattern strengthens the case for the end of the downtrend.
2. Bearish Hidden Divergence Signal
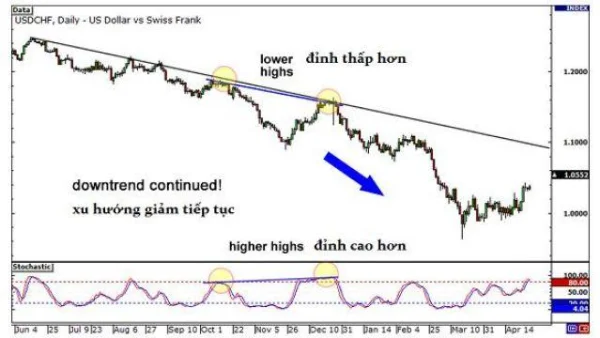
In another daily chart example, during a downtrend, prices form lower highs, but the Stochastic indicator creates higher highs. This confirms bearish hidden divergence.
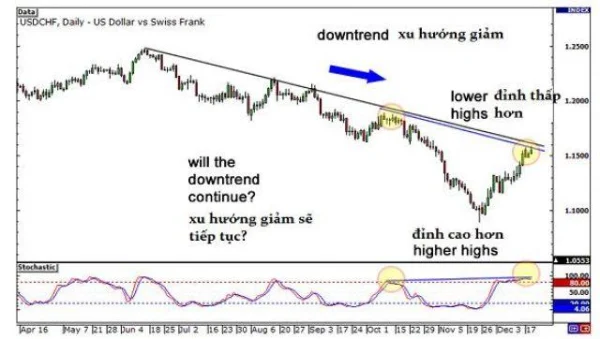
The next step is to open a short position following the current trend. As seen, prices continue to decline sharply, offering substantial profit opportunities for those who traded on this signal.
How to Trade Divergences More Effectively?
Divergence is a powerful tool, but it’s not flawless. False signals are inevitable and may lead to unwanted losses. So, how can you minimize the risks of trading with divergences? Here are some practical tips you can apply.
Wait for a Cross
A golden rule you should never overlook: be patient and wait for a technical indicator to cross over. This crossover indicates a significant shift in market momentum, either from buying to selling or vice versa. Crossovers often mark the formation of a peak or trough—key signals to confirm divergence.
1. Real-World Example with Hidden Bearish Divergence
Imagine a chart showing a currency pair in a downtrend. When the price creates lower highs, but the Stochastic indicator shows higher highs, this indicates a hidden bearish divergence.
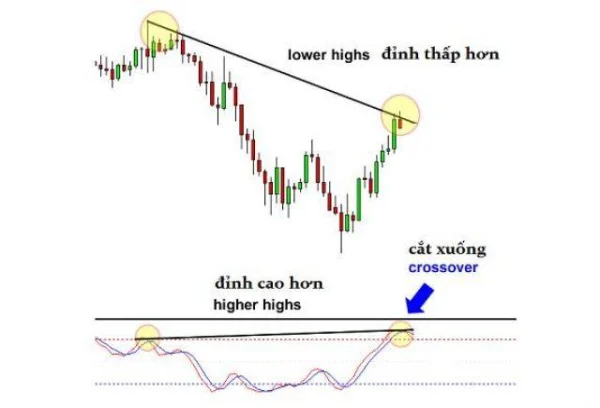
Instead of rushing to place a sell order, patiently wait for the Stochastic indicator to cross downward, confirming that bearish momentum is returning. After a few candles, this crossover occurs, and the downtrend continues. At this point, selling becomes not only safer but also allows you to optimize your profits.
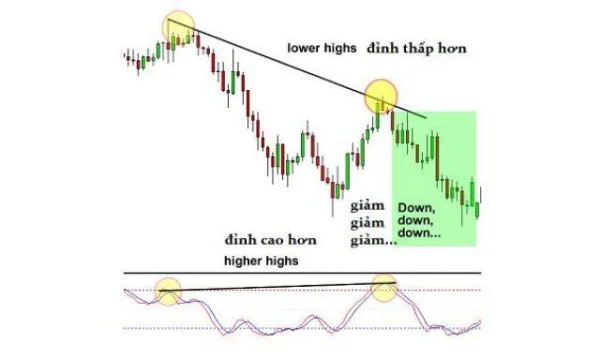
Don’t rush to execute orders immediately upon detecting divergence. Waiting for confirmation is an effective way to avoid losses caused by false signals.
Wait for the Indicator to Exit Overbought/Oversold Zones
Another way to increase the accuracy of your trades is to wait for the technical indicator to exit the overbought (Overbought) or oversold (Oversold) zones. This helps you avoid entering trades when market momentum hasn’t truly shifted.
2. Illustration with MACD
Suppose on the chart, the price continues to decline while the MACD forms higher lows. You might think this is a good time to buy since divergence has appeared. However, if the MACD is still in the oversold zone, this indicates that selling pressure hasn’t diminished, and the price could continue to drop further.
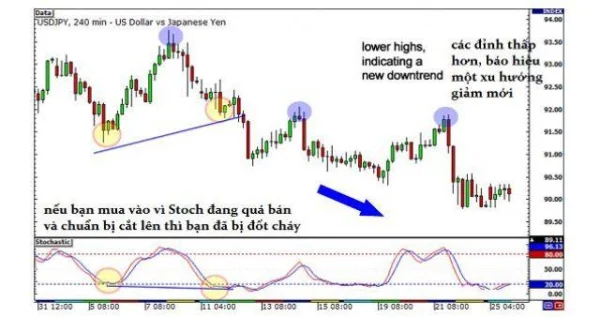
In reality, a new downtrend may form, with the price continuously making lower lows. If you don’t wait for the indicator to exit the oversold zone and other signals to confirm, you risk significant losses.
Don’t trust divergence when the indicator is still in the overbought/oversold zone. Be patient and wait for additional confirmation signals.
Draw Trendlines on Technical Indicators
Try applying a little-known tip: draw trendlines on technical indicators. This isn’t just for price charts—it’s also highly useful for spotting reversal signals when both price and the indicator break their trendlines.
3. Application with MACD
For example, when the price moves along a downtrend line, draw a similar trendline on the MACD. If both the price and MACD break their respective trendlines, this suggests that buying or selling pressure is shifting strongly, and the current trend is likely ending.
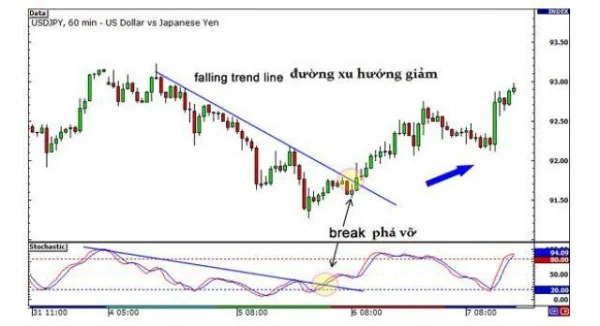
Drawing trendlines on technical indicators not only adds another layer of analysis but also helps confirm reversal signals with greater reliability.
Summary of Divergence Trading Rules
Divergence is an important tool in trading, but to use it effectively, you need to follow some basic rules. Here’s a detailed guide to help you apply divergence accurately and maximize profits.
1. Confirm Divergence Signals
Ensure the price chart meets one of the following conditions before checking technical indicators:
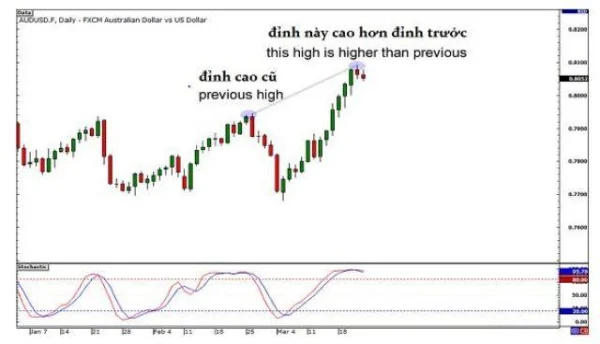
- The price forms higher highs than the previous high.
- The price forms lower lows than the previous low.
- The price forms a double top.
- The price forms a double bottom.
If none of these patterns appear, there’s no need to check the technical indicator.
2. Draw Straight Lines Connecting Highs or Lows
When detecting one of these patterns, follow these steps:
- Draw a straight line connecting the clearly formed highs or lows.
- Ensure you only draw once the highs/lows are fully formed—don’t draw while they’re still developing.
3. Compare Highs and Lows Between Price and Technical Indicators
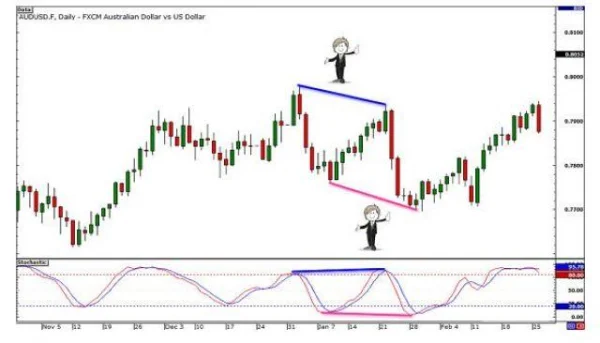
- If connecting highs in the price, draw a line connecting the highs of the technical indicator.
- Similarly, if connecting lows in the price, connect the lows of the technical indicator.
- Ensure the highs/lows of the price and the indicator correspond vertically.
4. Observe the Connecting Line
Divergence only appears when:
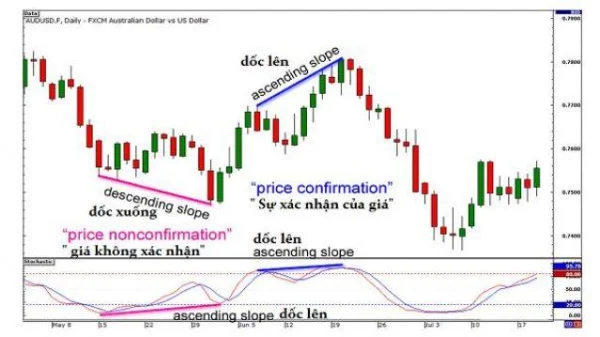
- The line connecting the highs or lows of the price differs from the corresponding line on the technical indicator.
- This line can slope upwards, downwards, or remain flat, but the difference between the two lines determines the existence of divergence.
5. Skip Opportunities If You Missed the Timing
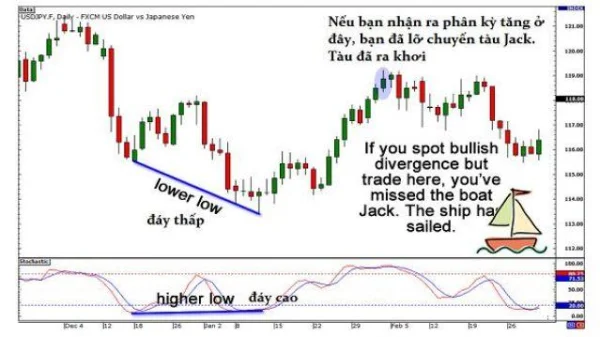
If you notice divergence but the price has already reversed and a new trend has formed, skip this opportunity. Don’t chase “trains that have already left the station.” Be patient and wait for another divergence to trade with higher accuracy.
6. Choose the Right Timeframe
- Long timeframes (H1 and above): Divergence signals are more reliable and less noisy. Although fewer signals appear, well-managed trades have a higher profit potential.
- Short timeframes (below H1): Signals appear more frequently but are less reliable due to many noisy factors. If you’re not an experienced trader, avoid using overly short timeframes.
In-Depth Analysis of Divergences in Investing
When discussing divergences, one key point that DLMvn always emphasizes is this: divergences are not just tools to identify signals on a chart, but rather a “story” behind shifts in investor sentiment. Understanding this perspective will help you see that divergences are not magical tools but an integral part of the bigger picture of market supply and demand.
Gaining Deeper Insights into Investor Psychology through Divergences
Divergences result from discrepancies between price movements and technical indicators. DLMvn often compares them to a “hidden battle” between buyers and sellers. For instance, when prices continue to rise but momentum (reflected by indicators like RSI or MACD) begins to weaken, it suggests the “bulls” are losing strength even though the price still maintains an upward trend.
Interestingly, divergences do not always accurately predict future movements. There are instances where a divergence appears, yet the price continues in its original direction. This situation often occurs in strongly trending markets, where the momentum of capital inflows outweighs technical signals.
Applying Divergences in Long-Term Investing
-
Identifying Potential Reversal Points
One of the most common uses of divergences is identifying trend reversal points. DLMvn recalls a notable example during the 2018-2019 period in the Vietnamese stock market. When the VN-Index dropped significantly to around 650 points, a bullish divergence between the price and RSI on the weekly chart appeared. This served not only as a warning signal but also provided long-term investors with an opportunity to buy at low prices before the VN-Index rebounded strongly.
-
Divergences in Cyclical Stocks
Stocks in sectors like steel or real estate often exhibit clear divergence signals, especially during transitions between growth and downturn cycles. For example, with Hòa Phát (HPG), in 2020, when the stock price continued to rise but the MACD indicator on the daily chart began to decline, a bearish divergence warned of a potential strong correction. This was an opportune moment for short-term investors to consider taking profits.
Divergences and the Importance of Timeframes
DLMvn often advises that selecting the appropriate timeframe for observing divergences is a critical factor in achieving success.
- Short timeframes (H1 or H4): Suitable for short-term traders, but signals are more prone to noise due to minor fluctuations.
- Long timeframes (weekly or monthly): Divergence signals become more reliable, especially when analyzing major market trends.
For instance, with Vinamilk (VNM) shares, during the 2017 to 2020 period, a bearish divergence appeared on the weekly chart as the price continued making new highs, but RSI failed to increase correspondingly. This not only warned of an adjustment phase but also helped long-term investors consider restructuring their portfolios.
Common Mistakes When Using Divergences
- Entering Trades Too Early
This is one of the most frequent errors DLMvn has observed among investors. Upon detecting a divergence, they hastily open positions without waiting for additional confirmation signals. This often leads to “catching a falling knife” in sharply declining markets.
- Failing to Combine with Supporting Tools
Divergences become much more effective when used alongside tools such as trendlines, candlestick patterns, or volume analysis. For example, if a bearish divergence coincides with the formation of a bearish reversal candlestick pattern like an “evening star,” the accuracy of predictions increases significantly.
Always remember, divergences are not a “holy grail.” To improve your chances of success, use them as part of a comprehensive trading strategy rather than as a standalone tool. Only enter trades when there are at least two additional confirmation signals.
Why Are Divergences More Important for Professional Investors?
Experienced investors always view divergences as an early signal of market health. Unlike other indicators that often appear when trends are already apparent, divergences allow them to “stay ahead of the curve.” This provides a significant advantage, especially in volatile markets where short-term opportunities arise during adjustments or reversals.
DLMvn once shared: “When you spot a divergence, think like a detective. Don’t just look at the chart—dig into why it’s happening, where the money is flowing, and which side is gaining the upper hand.” Divergences may not be perfect tools, but they are an indispensable piece of the overall market puzzle.

DLMvn > Trading Indicators > Essential Knowledge for Interpreting Divergence Signals
Expand Your Knowledge in This Area
Trading Indicators
Exploring the Relationship Between Bollinger Bands and MACD
Trading Indicators
An Introduction to the 5 Doji Candle Patterns
Trading Indicators
Decoding Overbought and Oversold Phenomena: What Do They Mean?
GlossaryTrading Indicators
Stochastic Oscillator: An Effective Tool For Forecasting Market Trends
Trading Indicators
Comprehensive Guide to Pivot Point: The Secret to Stock Market Analysis
Trading Indicators
Trade Smarter with Long Wick Candles