TABLE OF CONTENTS
- What Is the Double Bottom Pattern?
- How to Identify a Double Bottom Pattern
- Real-World Analysis on Global Stock Markets
- Trading Guidelines for the Double Bottom Pattern
- The Flexibility of Applying the Double Bottom Pattern
- Analyzing Opposing Perspectives
- The Role of Trading Volume
- Suggestions to Enhance Trading Effectiveness
What Is the Double Bottom Pattern?
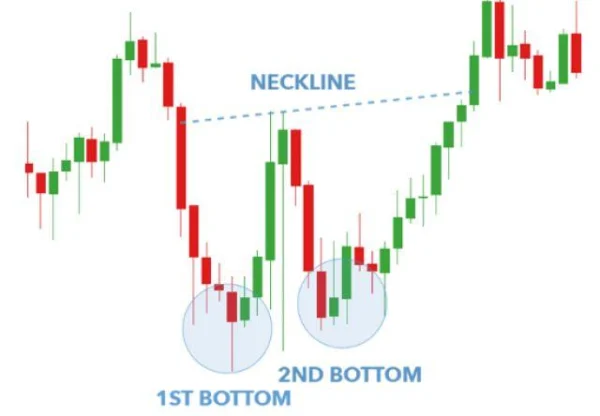
The Double Bottom pattern is one of the essential chart structures often seen at the end of a downtrend. It is regarded as a potential reversal signal, helping traders identify favorable buying opportunities. The characteristic shape of this pattern resembles the letter “W,” with two troughs at nearly the same level, connected by a peak known as the neckline.
The emergence of a Double Bottom pattern signifies that selling pressure is gradually weakening, while buyers are regaining control, pushing the price above the resistance at the neckline. Historical data shows that the Double Bottom pattern has a high success rate, especially when confirmed by a surge in trading volume.

How to Identify a Double Bottom Pattern
-
Identify two troughs at approximately the same price level.
These two troughs should be within an acceptable range, not necessarily identical, but clearly similar. -
The distance between the two troughs should not be too short.
This depends on the time frame you are analyzing. For daily charts, the gap should span at least several weeks to ensure effectiveness. -
Confirm the neckline.
The neckline is the resistance level formed at the highest point between the two troughs. Breaking and closing above this line confirms an uptrend. -
Combine with technical indicators.
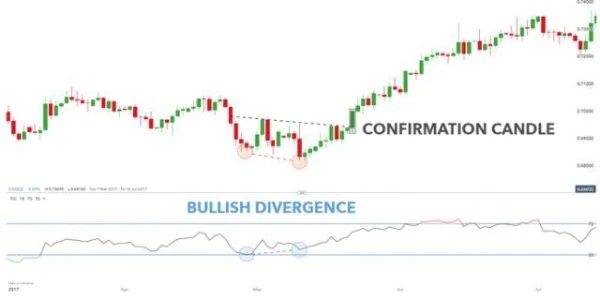
Indicators like RSI (Relative Strength Index), MACD (Moving Average Convergence Divergence), or trading volume can further support the bullish signal from the Double Bottom pattern.

Real-World Analysis on Global Stock Markets
1. The Double Bottom Pattern on Apple (AAPL) Stock Charts
In 2020, Apple (AAPL) stock formed a clear Double Bottom pattern following a sharp decline in March. The two troughs were created at a price of $225, with the neckline at the $250 resistance level. Once the price broke this level, the market witnessed a strong rally, pushing the stock to $300 within just two months.

Notably, confirmation came from trading volume, which increased by more than 50% compared to the average level, indicating strong buying participation. This reinforced confidence in the signal provided by the Double Bottom pattern.
2. Double Bottom Pattern in the Dow Jones Industrial Average (DJIA)
During the global financial crisis of 2008, the DJIA formed a Double Bottom pattern around 7,500 points. The first trough appeared in October 2008, while the second trough was formed in March 2009. When the index broke above the 8,500 points resistance level, a strong uptrend ensued, lasting over a decade.
This demonstrates that the Double Bottom pattern is not only applicable to individual stocks but also effective on major indices.
Trading Guidelines for the Double Bottom Pattern
1. Identify Entry Points
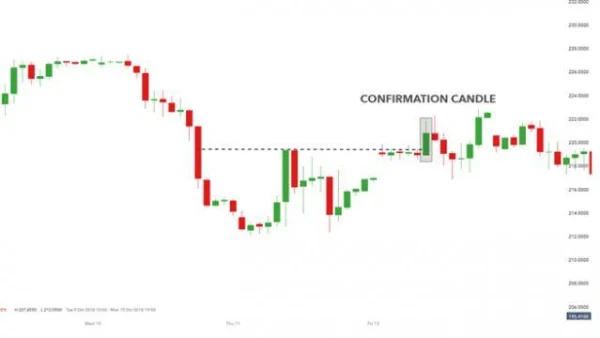
The ideal entry point is typically right after the price closes above the neckline. However, to reduce risk, you may wait for an additional confirmation candle with high trading volume.
2. Set Stop-Loss Orders
The appropriate stop-loss level is below the troughs of the pattern. This helps you control risk if the trend does not proceed as expected.
3. Establish Profit Targets
Based on the distance from the neckline to the trough, you can estimate a profit target. For example, if this distance is $10, the price target might be set at $10 above the neckline.
Never trade based on a single pattern alone. Always verify alignment with technical indicators and overall market conditions. Moreover, applying the Double Bottom pattern on larger time frames, such as weekly charts, often yields better results than on smaller time frames.
The Flexibility of Applying the Double Bottom Pattern
The Double Bottom pattern is not only useful in stock trading but can also be effectively applied to other asset classes, such as market indices, ETFs, or even futures contracts. A prime example occurred in 2020 when the S&P 500 formed a Double Bottom during its recovery from the pandemic-induced crash. The two troughs were established at 2,200 points, while the neckline was confirmed at 2,800 points. After breaking this level, the S&P 500 rallied strongly, reaching 3,500 points by the end of the year.
The flexibility of this pattern lies in its adaptability to various time frames, ranging from short-term trades to long-term investments. However, to maximize effectiveness, traders should consider macroeconomic factors and market volatility.
Analyzing Opposing Perspectives
Many investors remain cautious when using the Double Bottom pattern, especially during periods of high market volatility. One notable weakness of this pattern is the potential for false breakouts. In reality, there are instances where prices break above the neckline but quickly reverse and invalidate the pattern structure.
A prominent example is Tesla (TSLA) stock in 2021. After forming two troughs at $550 and breaking the neckline at $700, the stock swiftly reversed and fell to $500, causing significant losses for investors who failed to set tight stop-losses.
This underscores the point that not all signals from the Double Bottom pattern are reliable. A combination of technical and fundamental analysis is indispensable.
The Role of Trading Volume
Trading volume is a critical supporting factor in confirming signals from the Double Bottom pattern. Typically, volume tends to decrease during the formation of the two troughs and surge when prices break above the neckline. Research on the U.S. market from 2000 to 2020 indicates that Double Bottom patterns with trading volume increasing by over 50% upon breaking the neckline have a success rate of up to 72%.
However, volume alone is not always sufficient for prediction. Traders should also monitor other technical indicators like RSI, MACD, or moving averages to gain a more comprehensive perspective.
Suggestions to Enhance Trading Effectiveness
-
Identify the appropriate time frame.
Larger time frames often provide more reliable signals. For instance, weekly charts can help filter out noise compared to daily or hourly charts. -
Evaluate market context.
The appearance of a Double Bottom pattern during a long-term downtrend generally has higher reliability compared to periods of consolidation or sideways markets. -
Utilize support and resistance levels.
The Double Bottom pattern becomes more effective when the troughs coincide with strong support zones or long-term moving averages like the 200-day SMA.
Instead of trading immediately when the price breaks above the neckline, consider waiting for confirmation from the next candlestick and trading volume. This approach helps minimize risks from false breakouts.

DLMvn > Trading Indicators > Double Bottom Pattern Signals an Uptrend
Expand Your Knowledge in This Area
Trading Indicators
“Trend is Your Friend” – How to Identify a Strong Trend in the Stock Market
Trading Indicators
Discover John Bollinger’s Bollinger Band Rules for Successful Trading
Trading Indicators
Trade Smarter with the Double Top Chart Pattern
Trading Indicators
Discover How to Combine Moving Averages with Candlestick Patterns Effectively
Trading Indicators
10 Candlestick Patterns Every Trader Should Know
Trading Indicators
Decoding Overbought and Oversold Phenomena: What Do They Mean?