TABLE OF CONTENTS
- What Is the Double Bollinger Bands Strategy?
- How to Trade with the Double Bollinger Bands Strategy
- Advantages and Disadvantages of Using Double Bollinger Bands
- A Deep Dive into Effectiveness and Challenges
- Contrary View: DBB Strategy Doesn't Always Succeed
- Real-World Examples from Major Stock Markets
- Perspective from Foreign Markets
Double Bollinger Bands (DBB) is a powerful strategy in technical analysis that helps traders identify strong market volatility and determine effective entry and exit points. This strategy not only relies on the traditional Bollinger Bands but also incorporates an additional set of Bollinger Bands to enhance the accuracy in assessing momentum and price volatility.
What Is the Double Bollinger Bands Strategy?
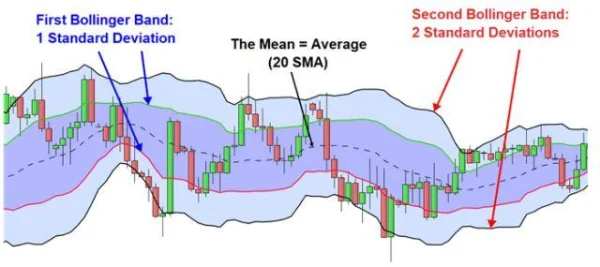
Double Bollinger Bands is a combination of two different Bollinger Bands sets. The traditional Bollinger Bands use a 2 standard deviation (20, 2) setting, while the second set uses a 1 standard deviation (20, 1) setting. This combination creates three key areas that help determine entry and exit points: the buy zone, the sell zone, and the neutral zone.
- Default Bollinger Band (20, 2): Measures market volatility over 20 periods with a standard deviation of 2, creating an upper and lower band surrounding the moving average.
- Second Bollinger Band (20, 1): Similar setup but uses a standard deviation of 1, resulting in a narrower band.

Statistics show that 95% of candles fall within the range of the two standard deviations, meaning signals appear frequently and help traders spot potential opportunities. However, this strategy requires careful attention to accurately identify signals and avoid false breakouts.
How to Trade with the Double Bollinger Bands Strategy
1. Breakout Trading Strategy
One of the powerful applications of Double Bollinger Bands is in breakout trading. When the price breaks out of the Bollinger Bands, especially when the bands are expanding, this is the time to prepare for a new trend. Like other trading strategies, Double Bollinger Bands can help you avoid false breakouts.
For example, in the EUR/GBP currency pair, when the price breaks above the upper band (the green line), many traders expect a strong breakout. However, the price doesn’t continue to move further, indicating a sign of stagnation in the trend. A large green candle then confirmed the real breakout and provided a strong buy signal.

Important tip: To minimize risk, you should place the stop-loss at the 20-period SMA line and set price targets based on key resistance levels. This helps maintain a positive risk/reward ratio and better protect your capital.
2. Trend Following with Double Bollinger Bands
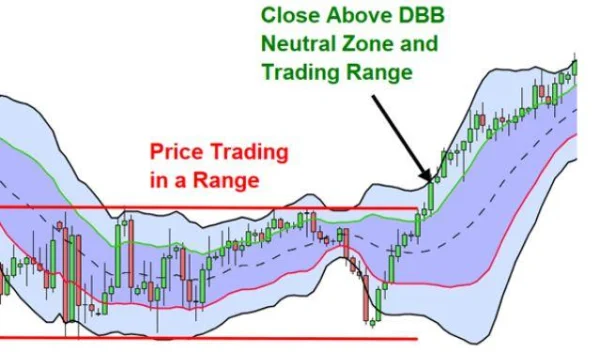
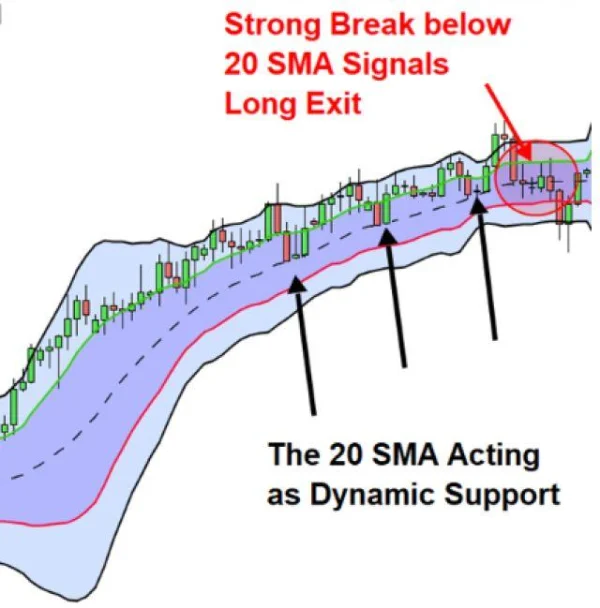
When the market is in a strong trend, the Double Bollinger Bands strategy can help you track momentum and volatility to either hold the position or exit it appropriately. If the market breaks the upper Bollinger Band and continues to move into the DBB Buy zone, this is a sign to hold the long position.
If the price stays between the buy band and the 20-period SMA line, you can continue holding the long position. However, if the price closes below the 20-period SMA line or breaks into the sell DBB zone, you need to prepare to exit to avoid losses.

Example: On the EUR/GBP chart, after breaking the upper band, if momentum and volatility continue strongly, you should hold the position until there are clear signs of reversal.
Advantages and Disadvantages of Using Double Bollinger Bands
Advantages
- Low volatility before big moves: When the market has low volatility, the Bollinger Bands narrow, often signaling a large breakout is about to occur.
- Clear signals: Entry and exit signals are easily identifiable. When the price enters the DBB buy zone, it’s a buy signal, and vice versa, entering the DBB sell zone is a sell signal.
- Easy identification of momentum: You can identify the current trend and momentum of the market through changes in the Bollinger Bands.
Disadvantages
- Breakouts may reverse: One of the major risks of using this strategy is that breakouts into the buy or sell zones can quickly reverse. This requires traders to have tight risk management strategies, especially in volatile markets.
To minimize the impact of false breakouts, you should combine other indicators like RSI or MACD to further confirm the signals.
A Deep Dive into Effectiveness and Challenges
Double Bollinger Bands (DBB) can be considered a great tool for traders looking to identify market volatility and momentum, but like any other trading strategy, DBB is not a “holy grail” and should be used with caution. One of the advantages of this strategy is its ability to provide clear signals when the price enters buy or sell zones. However, you cannot rely solely on these signals without considering other market factors.
One of the biggest issues when using DBB is the risk of encountering false breakouts. In fact, global stock markets often experience “testing” periods – when the price moves into buy or sell zones but then reverses. This is a challenge that traders using DBB need to prepare for, especially when the market is in an unstable phase.
For example, in the U.S. stock market in 2020, when the COVID-19 pandemic broke out, the stock market experienced significant volatility, particularly in indices like S&P 500 and NASDAQ. Breakouts into the DBB buy and sell zones were often unsustainable, and in many cases, prices quickly reversed, causing traders to get caught in wrong moves if not careful.
In fact, in March 2020, the S&P 500 index fell nearly 34% in less than a month, but then rebounded strongly in April. This highlights the extreme volatility of the market in a short time, and breakouts into DBB can easily reverse during such periods.
Contrary View: DBB Strategy Doesn’t Always Succeed
Many experts believe that the Double Bollinger Bands strategy may not be suitable for all types of markets. Specifically, in low-volatility or sideways markets, this strategy can lead to “false signals” and missed opportunities. In sideways markets, when prices do not have a clear trend, entry and exit signals may not be strong, and traders will face a higher risk of losses due to false breakouts.
A notable example is in 2018, when the DAX (Germany) index spent a long period moving within a narrow range. Traders using DBB during this period would have encountered difficulties, as the signals from DBB were not clearly confirmed and did not help them identify effective entry points. In this case, using a simple Bollinger Bands strategy or trend-following breakouts might have been more effective.
Real-World Examples from Major Stock Markets
When applying the Double Bollinger Bands strategy, it is important to adjust the strategy according to the specific characteristics of each market. For example, in the U.S. Stock Market, especially in large stocks like Apple (AAPL) and Tesla (TSLA), DBB often provides good results when the market is in a strong trend. Both of these stocks have shown clear breakouts into the DBB buy zones over the years, particularly when positive earnings news was announced.
In the case of Tesla in 2021, the stock price surged after breaking above the upper Bollinger Band. At the same time, traders applying DBB were able to identify buy signals and track the strong volatility of this stock, helping them earn significant profits.
However, in markets affected by macroeconomic factors, such as changes in interest rate policies or economic crises, the DBB strategy does not always yield favorable results. In such cases, signals from DBB may not be strong enough to accurately predict market reversals, especially when external factors heavily influence stock prices in ways that DBB cannot fully explain.
Perspective from Foreign Markets
Some studies suggest that the Double Bollinger Bands strategy works best in periods when the market has a clear trend, such as in the U.S. stock market in 2017, when indices like the Dow Jones Industrial Average (DJIA) and S&P 500 continuously set new records. However, in markets with strong fluctuations and uncertainty, DBB does not always deliver good results.
Meanwhile, in the Japanese Stock Market, traders have found that using Double Bollinger Bands combined with fundamental analysis can help better predict strong breakouts, especially in high-liquidity stocks like Toyota (7203) or SoftBank (9984). These breakouts usually occur when the macroeconomic environment shows signs of stability, making the DBB signals more accurate.

DLMvn > Trading Indicators > Double Bollinger Bands: Strategy for Predicting Market Volatility
Tagged Articles
Exploring the Relationship Between Bollinger Bands and MACD
Discover John Bollinger’s Bollinger Band Rules for Successful Trading
Bollinger Bands
Trading with Bollinger Bandwidth: Identifying Accurate Entry Points
Expand Your Knowledge in This Area
Trading Indicators
Triangle Patterns: The Most Common Patterns Appearing on Charts
Trading Indicators
Clearly Identifying the Flag Pattern in Trading
Trading Indicators
Pitchfork and Its Key Benefits in Trading
Trading Indicators
Price Action vs Indicators – Which One Suits Your Trading Style?
Trading Indicators
Pivot Points: How to Identify Support and Resistance Levels
Trading Indicators
Trading with Bollinger Bandwidth: Identifying Accurate Entry Points