TABLE OF CONTENTS
- Components of Market Context
- Trading Rules with the 20 EMA
- Evening Star – A Classic Pattern
- Bearish Engulfing – The Power of Rejection
- Bullish Engulfing – A Popular Bullish Signal
- Confirmation – The Necessary Condition for Entry
- The Role of Market Context
- The Importance of Combining Analytical Tools
- Challenges in Applying MAs and Candlestick Patterns
- Factors Affecting Trading Effectiveness
- Specific Tips from DLMvn
- A Contrasting Perspective: Simpler Strategies
Candlestick patterns, when used in isolation, often fail to provide optimal value in trading. You’ve likely heard the saying, “A single candlestick pattern tells little without the proper context.” This is absolutely true. To maximize effectiveness, candlestick patterns must be analyzed within a specific market context. But what does that context entail?
Components of Market Context
- The overall market trend.
- Key support and resistance levels.
- Short-term and long-term price structures.
- Current price volatility.
While these factors may seem complex, a simple tool can help – the Moving Average (MA). The MA is not just a powerful technical indicator but also a bridge for integrating candlestick patterns into trading analysis. Candlestick patterns reflect the immediate market sentiment, while the MA provides a broader perspective on trend and momentum.
Below, you’ll find specific strategies to harness this combination effectively.
Trading Rules with the 20 EMA
The 20 EMA is a popular choice due to its sensitivity to price movements. However, you can adjust the type of MA and the period to suit your trading style. The trading rules include:
Buying Rules
- Price must pull back near the upward-sloping 20 EMA, indicating an uptrend.
- A bullish candlestick pattern forms near the 20 EMA.
- Enter a buy order when the price breaks above the high of the last candle in the pattern.
Selling Rules
- Price pulls back near the downward-sloping 20 EMA, indicating a downtrend.
- A bearish candlestick pattern forms near the 20 EMA.
- Trigger a sell order when the price breaks below the low of the last candle in the pattern.
Now, DLMvn will provide practical examples to illustrate how to apply these strategies.
Evening Star – A Classic Pattern
The Evening Star is a bearish candlestick pattern consisting of three consecutive candles. In the chart below, you’ll see an example of a strong bearish setup.
1. The Resistance Role of the 20 EMA
In a downtrend, the 20 EMA often acts as a dynamic resistance. In this example:
- Price attempted to break above the 20 EMA twice but failed, as indicated by long upper wicks.
- The previous gap-down created an additional key resistance level, reinforcing the likelihood of a pullback.
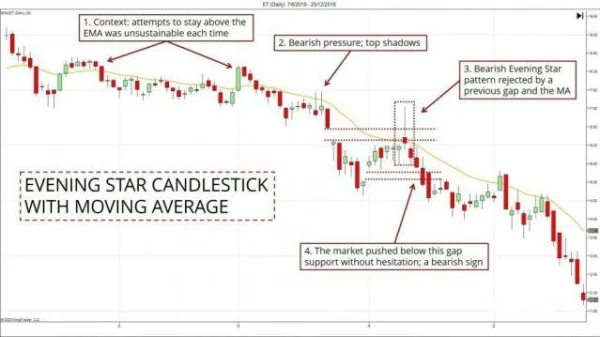
2. Confirmation from the Evening Star
The pullback ended with an Evening Star pattern aligning with resistance from the gap and the 20 EMA. The strong bearish momentum that followed not only broke the nearby support zone but also presented a high-potential trading opportunity.
Bearish Engulfing – The Power of Rejection
Bearish Engulfing is one of the most popular and effective candlestick patterns when trading with the EMA. On the chart, DLMvn identified an excellent entry point as follows:
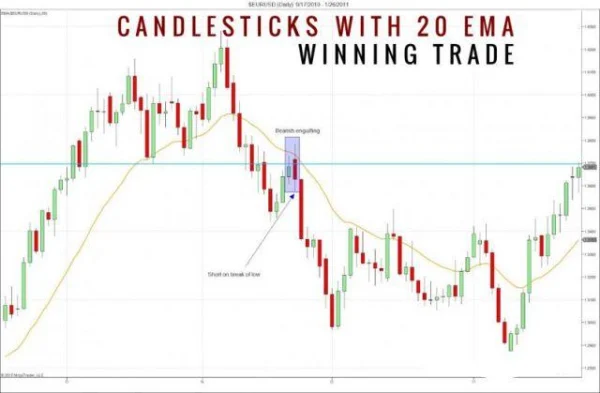
1. Pullback Creates Resistance
- After an uptrend, the market reversed with a strong decline. Three consecutive large red candles initiated the downtrend.
- When the pullback returned to the 20 EMA, this area coincided with resistance defined by the previous price floor.
2. Momentum from the Engulfing Pattern
The Bearish Engulfing pattern at the 20 EMA confirmed clear rejection from resistance levels. A sell order triggered at the low of the engulfing candle quickly yielded positive results. Notably, the large gap between the price and the EMA highlighted strong bearish momentum, increasing the probability of success.
When trading with candlesticks and the EMA, pay attention to the gap between price and the MA. A large gap often signals high momentum, helping you identify better trading opportunities.
Bullish Engulfing – A Popular Bullish Signal
Among candlestick patterns, Bullish Engulfing is one of the most popular and recognizable signals. Compared to less frequent patterns like Piercing Line or Morning/Evening Star, Bullish Engulfing occurs more often. However, this does not mean you can trade indiscriminately without careful consideration.
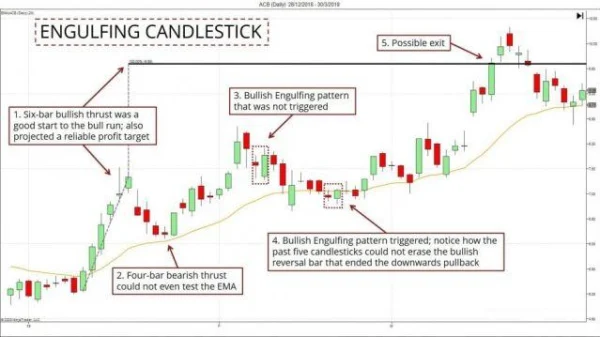
Analyzing Bullish Engulfing Trade Setups
- On the left of the chart, a series of 6 consecutive bullish candles initiated a strong new uptrend.
- Meanwhile, four bearish candles that followed indicated the market was testing the strength of the uptrend. However, prices remained above the EMA, which acted as a strong dynamic support.
- After reaching a new peak, the market retraced and formed a Bullish Engulfing pattern. However, this pattern did not trigger the breakout rule, leaving the buy signal unclear.
- Another Bullish Engulfing pattern appeared when the price broke above the EMA. This time, the trading rule was triggered, providing a favorable buy signal.
- The R:R ratio (Risk-Reward) of this setup was particularly attractive, aligning with the goal of safe and efficient trading.
Confirmation – The Necessary Condition for Entry
Bullish Harami Pattern
- A Bullish Harami formed just above the EMA, suggesting that prices could continue rising.
- The next day, the price broke above the high of the Inside Bar candle, triggering a buy order according to the rule.
- However, the price quickly fell afterward, resulting in a small loss on the trade.
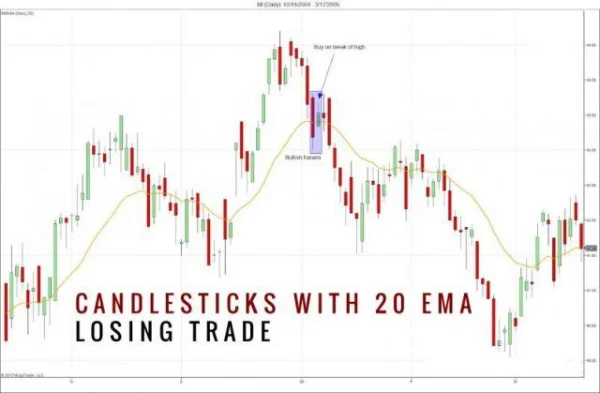
When trading candlestick patterns, especially those with lower reliability like Harami, waiting for confirmation is essential. A follow-up candle serves as confirmation and helps filter out false signals. However, waiting may mean missing out on better entry prices. This trade-off is something every trader must carefully consider.
The Role of Market Context
To better understand the role of market context, let’s examine the Morning Star pattern in two different market scenarios.
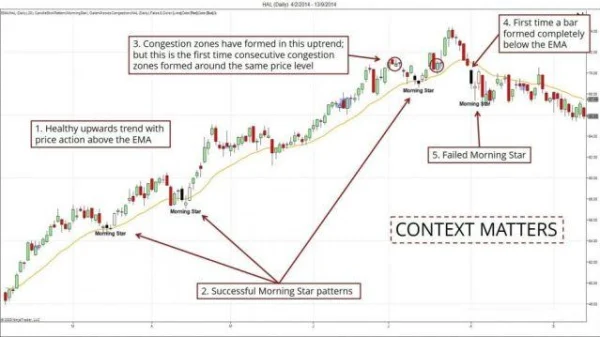
1. In a Clear Uptrend
- During a strong uptrend, Morning Star patterns consistently prove effective. The EMA acts as dynamic support, preventing prices from falling further.
- In this context, three Morning Star signals provided attractive buying opportunities, boosting investor confidence.
2. When Market Structure Changes
- As the market starts to plateau, sideways movements frequently occur around a fixed price range, signaling that the uptrend is weakening.
- A clearer sign appears when a candlestick pattern forms entirely below the EMA. This indicates a shift in market structure.
- In this new context, the Morning Star pattern loses its effectiveness, resulting in failed buy signals.
No matter how perfect a candlestick pattern may appear, the success of a trade heavily depends on the market context. Confidence in the trend should take precedence over adherence to isolated technical signals.
The Importance of Combining Analytical Tools
In stock trading, relying solely on candlestick patterns or moving averages (MAs) often yields suboptimal results. Why is that? Each tool has its own strengths and weaknesses. Candlestick patterns excel at identifying short-term signals but lack long-term context. Meanwhile, MAs provide an overall view of trends but lack the detail needed to pinpoint optimal entry points. Thus, combining these two tools can create a more comprehensive strategy.
For instance, an investor using the EMA 20 to track market trends can easily identify dynamic support or resistance zones. When a candlestick pattern forms in these areas, the trading signal becomes much more reliable. However, keep in mind that not all patterns carry the same significance under different market conditions. This is why market context is an indispensable factor.
Challenges in Applying MAs and Candlestick Patterns
Despite their effectiveness, this combination comes with challenges that traders need to be aware of:
Signal Noise: In sideways markets, the EMA often fails to display clear trends, leading to false signals. This can frustrate traders or cause unnecessary losses.
MA Lag: Moving averages like EMA or SMA (Simple Moving Average) have a lag, meaning they react slowly to sudden price changes. This can lead to missed trading opportunities.
Candlestick Pattern Confirmation: Not every candlestick pattern requires additional confirmation, but misjudging a pattern’s reliability can lead to poor trading decisions. For example: Bullish Engulfing patterns are generally more reliable than Harami, but they may still fail without the right context.
Factors Affecting Trading Effectiveness
1. Trading Cycle
When using MAs with candlestick patterns, adjust the time frame to suit your strategy. The EMA 20 is commonly effective on daily or 4-hour charts. However, short-term traders may prefer the EMA 9 or EMA 14 on 1-hour charts for quicker signals.
2. Trading Volume
Trading volume is an important supplementary factor often overlooked by investors. A candlestick pattern formed with low volume is usually unreliable. Conversely, if a pattern at the EMA is accompanied by a volume spike, the trading signal becomes much stronger.
3. Market Sentiment
Investor sentiment also plays a significant role in strategy effectiveness. For example: During a bullish market, bullish patterns like Bullish Engulfing are more likely to succeed. However, in a bearish or uncertain market, even strong patterns can fail.
Specific Tips from DLMvn
To improve your win rate, do not rely solely on candlestick or MA signals. Check supplementary factors such as trading volume, price structure, and the position of the signal within the overall trend.
When the EMA 20 shows a strong uptrend but a bearish candlestick pattern forms, be cautious of false signals. Wait for additional confirmation before making decisions.
In sideways markets, avoid trading based on candlestick signals if the EMA does not indicate a clear trend. This is a good time to observe and preserve capital.
For reliable patterns like Bullish Engulfing, use higher time frames to minimize noise. Daily charts are a popular choice for long-term investors.
A Contrasting Perspective: Simpler Strategies
While combining MAs and candlestick patterns can enhance trading performance, some investors believe: “Simplifying strategies reduces risk.” For them, relying on a single EMA signal (e.g., crossover) is sufficient for making trading decisions. This approach, while not incorrect, misses out on potential opportunities that candlestick patterns can provide.
Ultimately, the suitability of a strategy depends on your trading style. A patient, risk-averse trader may prefer a simple approach. Conversely, an adventurous trader willing to take risks may find the combination of MAs and candlestick patterns offers a significant edge.

DLMvn > Trading Indicators > Discover How to Combine Moving Averages with Candlestick Patterns Effectively
Tagged Articles
Popular Moving Averages and How to Choose the Best One for Your Strategy
Moving Averages – A Comprehensive Overview
Expand Your Knowledge in This Area
Trading Indicators
How to Effectively Use Harmonic Price Patterns in Trading and Investing
Trading Indicators
Harami Candlestick Pattern and How to Trade It for Maximum Profit
Trading Indicators
Clearly Identifying the Flag Pattern in Trading
Trading Indicators
Trading with Bollinger Bandwidth: Identifying Accurate Entry Points
Trading Indicators
10 Candlestick Patterns Every Trader Should Know
GlossaryTrading Indicators
Moving Averages – A Comprehensive Overview