TABLE OF CONTENTS
- What is the Cup and Handle Pattern?
- How to Trade with the Cup and Handle Pattern
- Advantages and Disadvantages of the Cup and Handle Pattern
- Characteristics of the Cup and Handle Pattern
- Market Analysis to Enhance the Effectiveness of the Pattern
- Things to Consider When Trading with the Cup and Handle Pattern
- Contrary Viewpoint: Not Always a Strong Pattern
The Cup and Handle pattern is one of the most popular technical patterns among traders. Especially when applied correctly within a trading system, this pattern can create significant profit opportunities. However, to achieve optimal results, trading with the Cup and Handle pattern is not always straightforward.
What is the Cup and Handle Pattern?
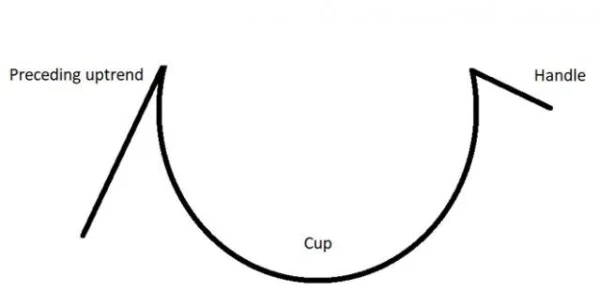
The Cup and Handle pattern is a continuation pattern that typically appears after a strong uptrend or downtrend, signaling that the trend is likely to continue. However, one thing that not all traders realize is that the formation of this pattern can take a considerable amount of time and requires a high level of patience from the trader.

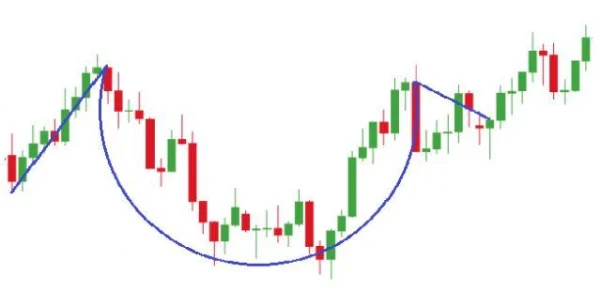
Looking at this pattern from a general perspective, the cup often has a curved shape, resembling a filled cup. The top of the cup has two peaks that are nearly equal, indicating a temporary stability before the market makes its next move. The handle is the extension below, which can form as either a flag or pennant pattern.
However, for many traders, the Cup and Handle pattern is not always easy to identify. Particularly for newcomers to the market, this pattern may cause confusion.

How to Trade with the Cup and Handle Pattern
1. Trading Stocks with the Cup and Handle Pattern
To better understand how to trade with this pattern, let’s look at a real example from the U.S. stock market.
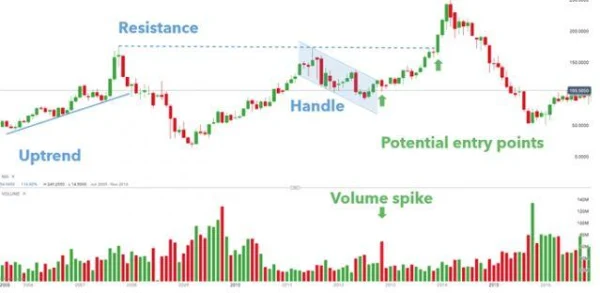
Wynn Resorts Ltd. is a company with a monthly chart that clearly shows the formation of the Cup and Handle pattern. Prior to this, an uptrend had been established, and a trendline was drawn to confirm this. After the Cup and Handle pattern formed, there were two potential entry points.

The first entry point occurs when the price breaks above the bullish flag, accompanied by a sharp increase in trading volume. This is a strong signal but can lead to a false breakout if not carefully verified. The second entry point appears when the price breaks through resistance, and the trendline is broken. This is a more cautious entry point, as it requires additional confirmation from the price trend.
When trading with the Cup and Handle pattern, determining the stop-loss level is crucial. Typically, the stop-loss will be placed below the bottom of the handle. Some traders may use Fibonacci extensions to determine target price levels.
2. Trading with the Cup and Handle Pattern
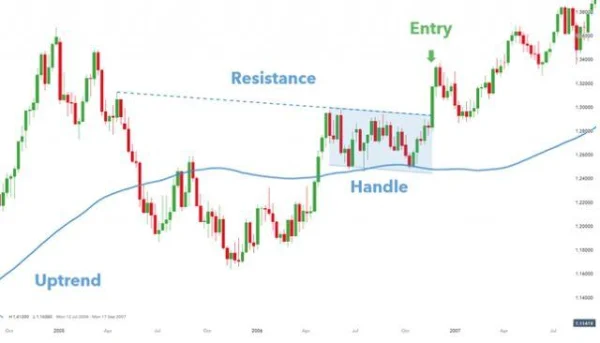
EUR/USD is a popular currency pair, and on the weekly chart of this pair, we can see a clear buying opportunity. The MA-100 moving average is used to confirm the uptrend before the Cup and Handle pattern forms.

In this case, the resistance line and the channel of the handle align, creating an accurate entry point for traders. Stop and limit levels will be determined similarly to the stock example above. However, an important difference is that there is no volume indicator to confirm the breakout.
Advantages and Disadvantages of the Cup and Handle Pattern
Advantages
The Cup and Handle pattern has clear advantages, especially for traders with more experience.
-
Easy to identify for experienced traders: Once you are familiar with the shape of the pattern, identification becomes easier than ever.
-
Clear stop, entry, and limit levels: This helps traders to plan their trades in detail and maintain more control during their market participation.
-
Applicable across different markets: This pattern is suitable for both stock, expanding trading opportunities for traders.
Disadvantages
While the Cup and Handle pattern offers many opportunities, there are also challenges to consider, especially for new traders entering the market.
-
Hard to identify for new traders: Traders with limited experience may struggle to recognize this pattern, as it requires a deep understanding of market structure.
-
Often requires additional technical indicators for confirmation: This pattern is usually not a standalone signal. Traders will need to use other technical indicators, such as moving averages, to confirm the trend and ensure they are not trading on false signals.
If you are a new trader, try applying the Cup and Handle pattern on a demo account before trading live. Remember, one of the most important factors when trading this pattern is patience. You cannot rush into a trade, as confirmation from the pattern is crucial to avoid unnecessary risks.
Characteristics of the Cup and Handle Pattern
One important characteristic when trading with the Cup and Handle pattern is the clarity in the steps of its formation. However, the market will not always behave according to what this pattern predicts. In some cases, the Cup and Handle pattern can become a price trap. You’ve probably heard of “false breakouts” – when the price breaks through a resistance level but then quickly reverses, causing traders who rushed into the trade to incur losses. This often occurs when the market lacks strong confirmation from other technical indicators.
For example, in the U.S. stock market, in 2014, Netflix (NFLX) stock formed a Cup and Handle pattern after a prolonged downtrend. However, the breakout at the $420 resistance level did not last long and quickly reversed, creating a “false breakout.” Traders who hurried to enter after the price broke the resistance level suffered significant losses. DLMvn emphasizes that if you only rely on the pattern without additional confirmation from indicators like RSI or MACD, it’s easy to be misled by false signals.
Market Analysis to Enhance the Effectiveness of the Pattern
One of the factors that help the Cup and Handle pattern succeed is its combination with fundamental analysis. Sometimes, a pattern can develop very strongly in a growing market but have no effect in a stagnant one. Therefore, assessing the state of the global market is crucial. A notable example is during the 2008 financial crisis, when many Cup and Handle patterns appeared in the U.S. stock market, but reduced purchasing power and liquidity rendered these signals meaningless. These continuation patterns couldn’t perform well due to a weak economic foundation and a lack of investor confidence.
DLMvn notes that to trade the Cup and Handle pattern more effectively, you need to combine it with other analyses, such as cash flow, market sentiment, and macroeconomic indicators. For instance, when the market is recovering after a recession, the Cup and Handle pattern can be a strong indicator that a new growth cycle is about to begin.
Things to Consider When Trading with the Cup and Handle Pattern
Although the Cup and Handle pattern is relatively easy to identify and the theory seems clear, in practice, it doesn’t always lead to the expected profits. Issues such as pattern lag, weak trading volume, or sudden changes from external factors like politics or economics can significantly impact trading results.
One common issue when applying this pattern is sudden changes in trading volume. While high volume typically accompanies a strong breakout of the pattern, sometimes a breakout with low volume can signal a failure of the pattern. DLMvn has witnessed many cases where this pattern broke down without the trend continuing, leading to losses for traders. Especially when trading volume does not support the breakout, traders are more likely to fall into sudden reversals.
Contrary Viewpoint: Not Always a Strong Pattern
You may hear many people say that the Cup and Handle pattern is “gold” when trading, but DLMvn has a different viewpoint. While this pattern can yield high profits in many situations, it’s not always the case. The pattern can fail if the market lacks strong confirmation from other technical indicators. One clear example is when Amazon (AMZN) formed the Cup and Handle pattern in 2015, but when it faced a decline in profits the following quarter, the pattern could not break out, causing many traders to fail.
Not every Cup and Handle pattern has great potential. There are cases where the pattern is simply a temporary “market characteristic” that does not reflect a long-term trend. In fact, DLMvn has observed many investors who become overly reliant on this pattern and ignore other important macroeconomic factors.

DLMvn > Trading Indicators > Analysis and Trading with the Cup and Handle Pattern
Expand Your Knowledge in This Area
Trading Indicators
Exploring the Relationship Between Bollinger Bands and MACD
Trading Indicators
Engulfing Pattern: A Reversal Signal in Technical Analysis
Trading Indicators
Understanding MACD: The Key to Enhancing Your Investment Strategy
GlossaryTrading Indicators
Stochastic Oscillator: An Effective Tool For Forecasting Market Trends
Trading Indicators
Trade Smarter with Long Wick Candles
Trading Indicators
Piercing Line and How to Use It for Market Top/Bottom Reversal in Trading