In the world of stock trading, understanding candlestick patterns is an extremely important tool that helps traders grasp price movements and make strategic decisions. Whether you’re a beginner or have years of experience, mastering candlestick patterns can provide a significant advantage in harsh markets like stocks. DLMvn has had the opportunity to observe and experience numerous times that, despite differences in trading strategies, the candlestick patterns listed below are always indispensable tools in the technical analysis toolbox of any investor.
What Are Candlestick Patterns?
Candlestick patterns are a technical analysis tool used to represent the price fluctuations of an asset over a specific time period. A candlestick includes four main data points: the open price, close price, highest price, and lowest price within the time period it represents. Each candlestick can reveal much about market sentiment at that moment, helping traders predict the next trend.
However, understanding candlestick patterns is not easy. Each pattern carries its own context and can sometimes provide contradictory signals. This makes trading both challenging and exciting. You need to learn how to combine them flexibly to make accurate decisions.
Bullish and Bearish Candlestick Patterns
In the stock market, candlestick patterns can be divided into bullish and bearish groups. Below is a summary of some common candlestick patterns that DLMvn has seen widely used:
Bullish Candlestick Patterns
- Morning Star: Bullish reversal
- Bullish Engulfing: Bullish reversal
- Doji: Can be bullish or bearish, indicating indecision
- Hammer: Bullish reversal
- Bullish Harami: Bullish reversal
- Piercing: Bullish reversal
- Inside Bar: Continuation of bullish trend
- Long Wicks: Can be bullish or bearish, indicating reversal
Bearish Candlestick Patterns
- Evening Star: Bearish reversal
- Bearish Engulfing: Bearish reversal
- Doji: Can be bullish or bearish, indicating indecision
- Bearish Harami: Bearish reversal
- Dark Cloud Cover: Bearish reversal
- Inside Bars: Can be bullish or bearish, indicating continuation
- Long Wicks: Can be bullish or bearish, indicating reversal
- Shooting Star: Bearish reversal
10 Candlestick Patterns Every Trader Should Know
1. Evening Star and Morning Star Patterns
These patterns appear at the end of uptrends or downtrends, often signaling a reversal. The Morning Star appears after a downtrend and predicts a bullish reversal, while the Evening Star appears after an uptrend and predicts a bearish reversal. Each pattern consists of three candlesticks, with the middle candlestick having a small body, indicating market indecision.
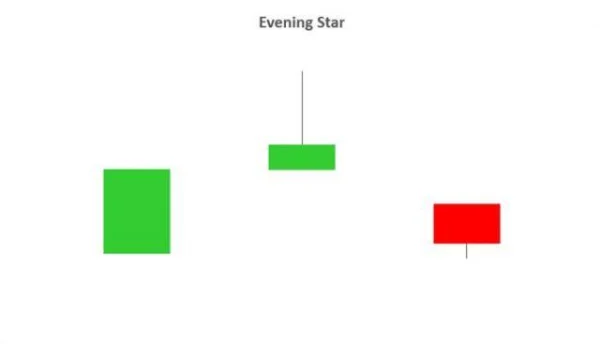
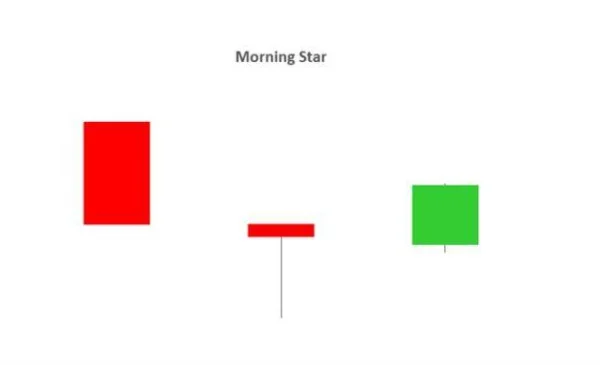
In practice, a Morning Star pattern typically signals the end of a downtrend and could be an opportunity to enter a buy position. Conversely, the Evening Star may signal an upcoming sell-off.
2. Bullish and Bearish Engulfing Candlestick Patterns
These patterns occur when a large candlestick completely engulfs the smaller previous candlestick, showing a strong change in market sentiment. The Bullish Engulfing signals the dominance of the buyers, indicating a reversal from bearish to bullish. On the other hand, Bearish Engulfing signals that the sellers have gained the upper hand, indicating a reversal from bullish to bearish.
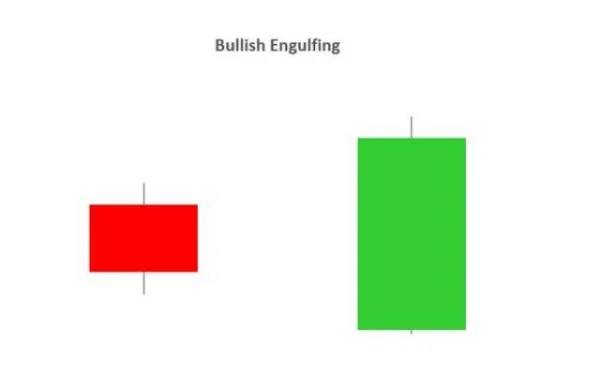
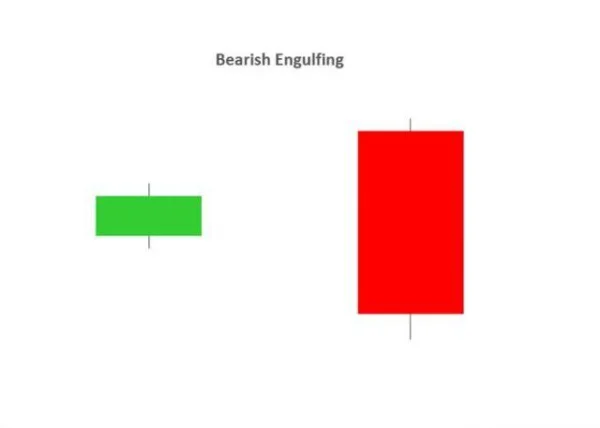
When this pattern appears in a market with a clear trend, it often provides strong signals for traders.
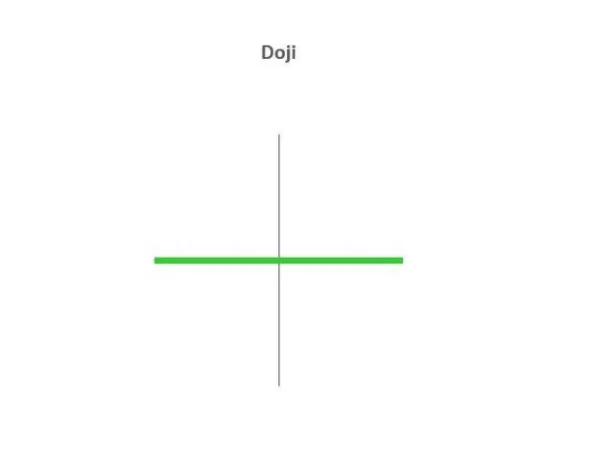
3. Doji Candlestick Pattern
The Doji pattern is one of the easiest candlestick patterns to identify, with a nearly nonexistent body and long upper and lower shadows. It indicates market indecision and can signal a reversal or continuation of the trend. However, a single Doji candlestick is not strong enough to make a trading decision; it needs confirmation from other signals.
4. Hammer Candlestick Pattern
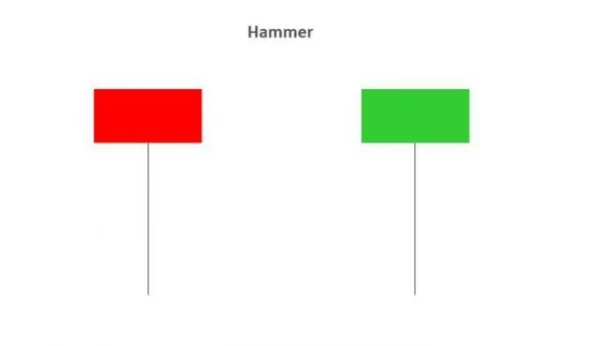
The Hammer pattern is a strong reversal signal when it appears at the bottom of a downtrend. With a small body and a long lower shadow, this pattern shows that the price has likely dropped too far and is rejecting further decline. A Hammer is even more reliable if confirmed by a bullish candlestick immediately afterward.
5. Bullish and Bearish Harami Candlestick Patterns
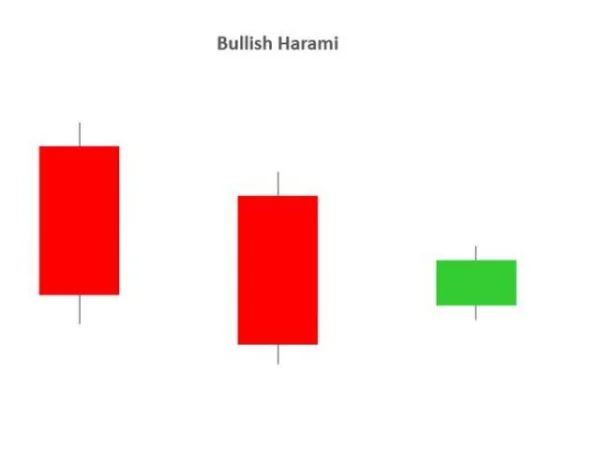
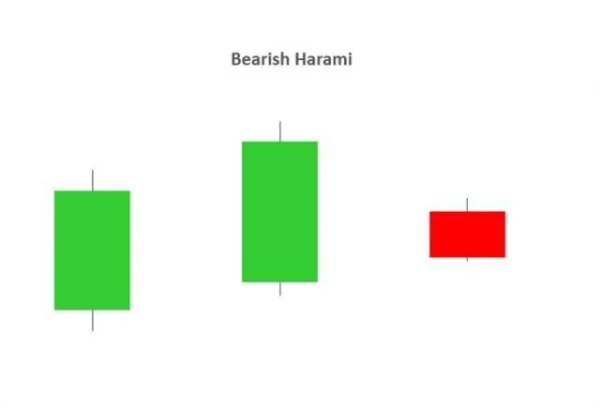
The Harami pattern, meaning “pregnant” in Japanese, resembles a large candlestick engulfing a smaller one inside it. Both Bullish Harami and Bearish Harami can signal a reversal. If it appears after a downtrend, Bullish Harami signals a potential reversal, while a Bearish Harami appearing after an uptrend suggests a possible downward correction.
6. Dark Cloud Cover Candlestick Pattern
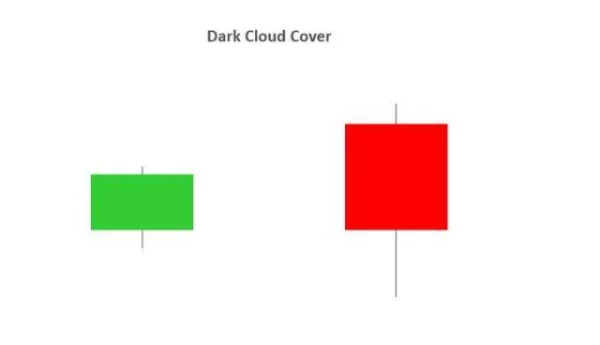
The Dark Cloud Cover is a bearish reversal pattern that typically appears after an uptrend. It consists of a bullish candlestick followed by a bearish candlestick, with the close of the bearish candlestick being below the halfway point of the previous candlestick. This indicates weakening buying pressure and the beginning of a downward trend.
7. Piercing Candlestick Pattern
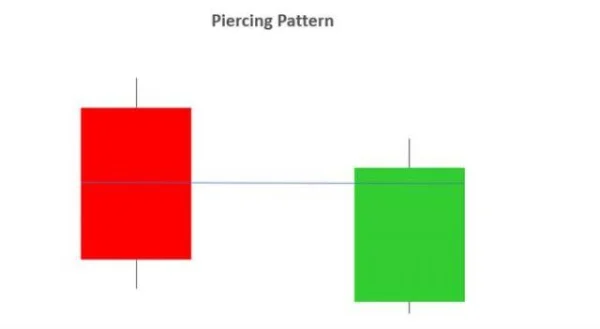
The Piercing pattern is a bullish reversal pattern that typically appears during a downtrend or at a support level. This pattern consists of two candlesticks: a bearish candlestick followed by a bullish one, with the bullish candlestick closing above the halfway point of the bearish candlestick. This suggests the market may reverse back to an uptrend.
8. Inside Bar Candlestick Pattern
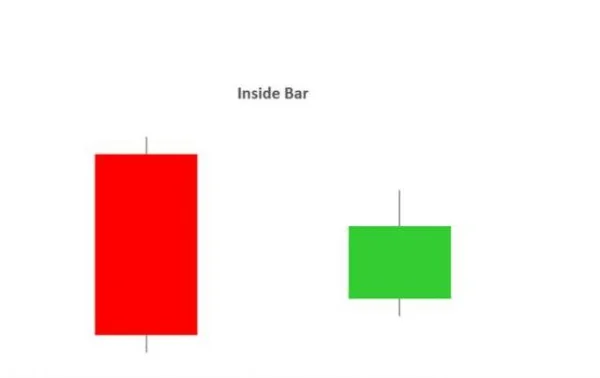
The Inside Bar pattern is one in which the second candlestick has both a higher high and lower low completely within the range of the first candlestick. This pattern indicates market indecision and often appears in trending markets. Traders can trade in the current trend or look for reversal signals at key support or resistance levels.
9. Long Wick Candlestick Pattern
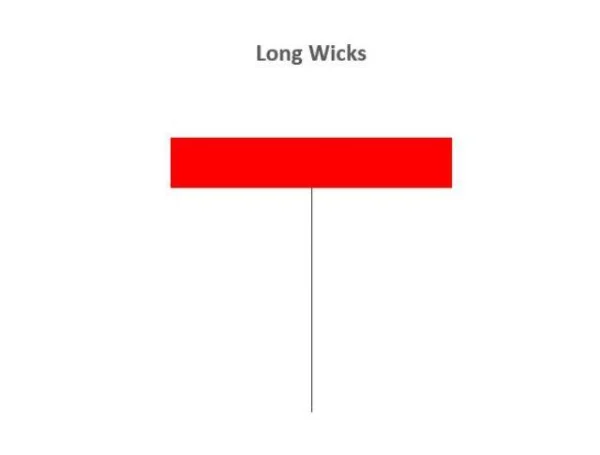
The Long Wick pattern is a strong reversal signal. When the market tests a certain price level but fails and rejects it, the long wick shows a significant change in investor sentiment. The appearance of a Long Wick signals that the market direction has shifted, and a reversal may be imminent.
10. Shooting Star Candlestick Pattern
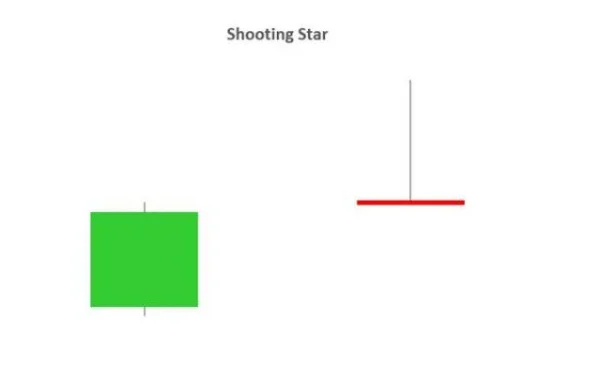
Finally, the Shooting Star is a bearish reversal pattern that appears in an uptrend. With a long upper wick and a small body at the bottom, this pattern indicates that the price attempted to rise but was rejected. This can serve as a warning signal to traders that the market may be preparing for a reversal.

DLMvn > Trading Indicators > 10 Candlestick Patterns Every Trader Should Know
Expand Your Knowledge in This Area
Trading Indicators
Discover How to Trade Using the Wedge Pattern
Trading Indicators
Understanding MACD: The Key to Enhancing Your Investment Strategy
Trading Indicators
Simple Trading Strategy with Support and Resistance
Trading Indicators
5 Variations of the Doji Star Candlestick Pattern
Trading Indicators
“Trend is Your Friend” – How to Identify a Strong Trend in the Stock Market
Trading Indicators
Essential Knowledge for Interpreting Divergence Signals