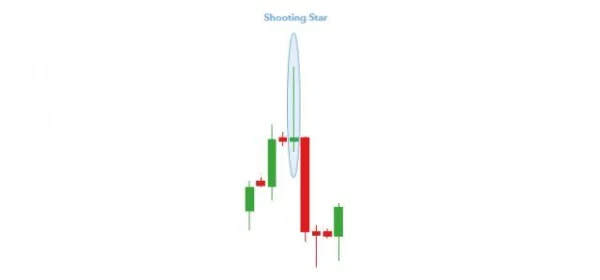
What is the Shooting Star Candlestick?
The Shooting Star candlestick, also known as a “shooting star,” is a very strong bearish reversal pattern. It appears when the price is pushed high but is immediately rejected, creating a long upper shadow, followed by a close lower than the open. This reflects a sudden shift in market sentiment, with investors aggressively selling after a price increase. The key characteristic of this pattern is that the upper shadow must be at least twice as long as the body, and the body itself must be short.

The Difference Between Shooting Star and Inverted Hammer
Although the Shooting Star and Inverted Hammer look quite similar, their positions of appearance are completely different. The Inverted Hammer appears at the end of a downtrend and signals a potential bullish reversal. In contrast, the Shooting Star appears at the top of an uptrend, indicating a bearish reversal. This highlights the importance of analyzing the position of the candlestick pattern to make an accurate decision.
Using the Shooting Star Candlestick in Technical Analysis
The Shooting Star is a great tool for beginner traders due to its simplicity and ease of recognition. When this pattern appears near a strong resistance level or trendline, it can confirm a bearish reversal signal. However, it is important to note that relying solely on this pattern will not guarantee success 100%. Confirmation from other technical factors, such as RSI, MACD, or Fibonacci levels, is needed to enhance the reliability of the signal.
Advantages of the Shooting Star Candlestick Pattern
One of the reasons the Shooting Star is favored by many traders is its simplicity in identification and use. This candlestick pattern can be easily spotted on charts and provides a clear reversal signal. Especially for newcomers to the market, the Shooting Star is one of the easiest patterns to understand when the market might reverse.
Additionally, the Shooting Star often appears in markets that are in a strong uptrend, helping traders confirm a potential bearish signal and creating an opportunity to enter a short trade.
Limitations of the Shooting Star Candlestick Pattern
Although the Shooting Star is a strong reversal signal, it is not a perfect signal and should not be used independently. If traders base their decision solely on this pattern to enter a short position, they may face significant risks. The lack of confirmation from other factors such as support/resistance levels, technical indicators, or other chart patterns could weaken this signal.
Therefore, to increase the likelihood of success, you should use the Shooting Star in conjunction with other technical analysis tools and consider the relevant fundamental factors.
Using the Shooting Star Candlestick Pattern in Trading
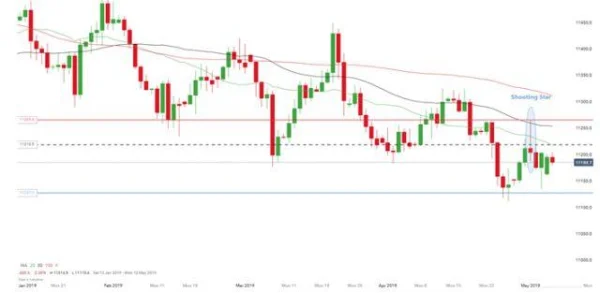
In global stock markets, trading with the Shooting Star candlestick pattern can be done in various ways. One of the simplest methods is to look for this pattern when the price has formed a strong uptrend, followed by a pullback. At this point, if the Shooting Star appears at a resistance level, you could enter a short position in the next trading session. Below is a practical example in trading the EUR/USD pair.

Specific Example: Trading with the Shooting Star
In the strong uptrend of EUR/USD, a Shooting Star candlestick appears at a key resistance level. A trader could enter a short position right after the Shooting Star closes, with a stop loss placed above the high of the candlestick and a target price at the nearest support level. The duration of the trade can vary depending on the timeframe being monitored, from a 1-hour chart to a daily chart.
Note that to optimize the trade, using additional indicators like RSI or MACD can help confirm the sell signal. For example, if the RSI reaches an overbought level and starts to decline, this further strengthens the bearish signal given by the Shooting Star.
Only enter a trade when all confirmation factors for a trend reversal signal, including support/resistance levels and technical indicators, align. Avoid trading when these factors are unclear, as you may face significant risks.
In-Depth Analysis of the Shooting Star Candlestick Pattern
The Shooting Star is not just a simple reversal candlestick pattern. To better understand how it works and why it can be a useful tool in trading, we need to dive into how to confirm this signal in real-world situations.
1. An Important Fact: The Shooting Star is Not Always Correct
Although the Shooting Star can signal a strong bearish reversal, it can also be a false signal if not confirmed properly. One of the biggest challenges when using this candlestick pattern is its reliance on the position it appears in on the chart. When it appears in a market without a clear trend or when liquidity is low, the Shooting Star pattern may simply be a short-term phenomenon with no actual reversal potential.
For example, in a stock market like the S&P 500 in 2018, a Shooting Star appeared during a trading session at the peak of a strong uptrend. However, the market did not drop sharply as expected, instead continuing to rise for the next 2 weeks, causing traders who entered short positions to suffer losses. This is a clear example of why it is necessary to confirm signals with other factors rather than relying on a single candlestick pattern.
2. Combining with Other Technical Indicators
One of the best ways to increase the reliability of the Shooting Star pattern is to combine it with other technical indicators. Using tools such as RSI (Relative Strength Index), MACD, or Fibonacci Levels can provide additional confirmation for the reversal signal.
For example, in July 2020, on the stock chart of Apple Inc. (AAPL), a Shooting Star appeared at a strong resistance level, while the RSI had reached a level of 70, indicating overbought conditions. Combined with a bearish divergence from the MACD indicator, this Shooting Star pattern signaled an accurate bearish reversal. After the Shooting Star formed, Apple’s stock price dropped more than 10% within a week.
3. The Correlation Between the Shooting Star and Resistance Levels
An extremely important factor in using the Shooting Star pattern is identifying the resistance level. If this candlestick appears at a strong resistance level that has been confirmed by the market previously, its reversal potential will be much higher. However, if the resistance level is unclear or weak, the signal from the Shooting Star may become ambiguous and unreliable.
For example, in the case of Amazon.com Inc. (AMZN) in August 2021, a Shooting Star appeared after the stock had risen sharply from $2,800 to $3,300 in a month. However, the resistance at $3,300 had not been clearly confirmed, and after the Shooting Star appeared, Amazon’s stock continued to rise to $3,500 within 2 weeks. This indicates that this candlestick pattern may not be reliable without confirmation from other technical factors.
You should confirm the Shooting Star signal not only with technical indicators but also through fundamental factors. For example, in companies with strong financials and stable growth, the appearance of a Shooting Star at weak resistance levels may not signal a significant reversal.
4. Special Markets: Highly Volatile Markets
In highly volatile markets, such as the European stock market in 2012, the Shooting Star pattern can become a false signal if not confirmed properly. In these markets, prices can fluctuate wildly, and many false reversal candlestick patterns may appear, confusing traders.
For example, during a period when the FTSE 100 Index in the UK in 2012 was experiencing strong fluctuations, a Shooting Star appeared on a day when negative news came from the Eurozone. However, due to market instability, this candlestick did not indicate an actual reversal, and prices continued to rise sharply afterward. This proves that when the market is unstable or influenced by macroeconomic factors, the Shooting Star pattern may not be reliable.
5. The Importance of Volume
Trading volume plays an important role in confirming the Shooting Star signal. If this pattern appears with high trading volume, the bearish reversal potential will be stronger. On the other hand, if the volume is low, it may just be a short-term reaction and not strong enough to lead to a prolonged downtrend.
For example, in October 2020, in trading Tesla stocks (TSLA) at $500, a Shooting Star appeared, along with a sudden increase in trading volume. Afterwards, Tesla’s stock dropped nearly 15% within two weeks. On the other hand, if the volume had been low at that time, the Shooting Star signal might not have been reliable, and the price could have continued to rise.
With the analysis and specific examples above, you can see that using the Shooting Star candlestick requires thorough confirmation and should be combined with other technical and fundamental analysis tools. Only when you understand these factors will the Shooting Star pattern truly unleash its power in helping you make accurate trading decisions.

DLMvn > Trading Indicators > What is the Shooting Star Candlestick Pattern? Meaning and How to Identify It
Expand Your Knowledge in This Area
GlossaryTrading Indicators
Stochastic Oscillator: An Effective Tool For Forecasting Market Trends
Trading Indicators
Engulfing Pattern: A Reversal Signal in Technical Analysis
Trading Indicators
Profiting from the Morning Doji Star Candlestick Pattern
Trading Indicators
Head And Shoulders Pattern: How To Identify Reversal Signals
Trading Indicators
“Trend is Your Friend” – How to Identify a Strong Trend in the Stock Market
Trading Indicators
What Is Price Action? A Basic Guide to Understanding This Method