TABLE OF CONTENTS
- How to Calculate MACD
- Components of the MACD Indicator
- How to Identify and Use MACD on a Chart
- Combining MACD with Other Indicators
- Some Limitations of MACD
- MACD – The Key or the Trap?
- Using MACD in Different Markets
- Challenges with MACD – Alternatives are Needed
- MACD and Ambiguous Signals
- The Powerful Combination: MACD and Long-Term Trading Strategies
MACD, which stands for Moving Average Convergence Divergence, was developed by Gerald Appel in 1979. It is one of the most important tools in technical analysis, helping investors identify market trends and potential entry and exit points. In fact, when used correctly, MACD can significantly enhance your trading effectiveness.
How to Calculate MACD
To understand MACD, you need to grasp the basic calculation formula:
MACD = EMA (12) – EMA (26)
Where EMA stands for Exponential Moving Average, with two periods of 12 days and 26 days. When the 12-day EMA is greater than the 26-day EMA, the MACD indicator will be positive. Conversely, if the 12-day EMA is lower, the MACD will be negative. Changes in the MACD indicate shifts in market price trends.
Components of the MACD Indicator
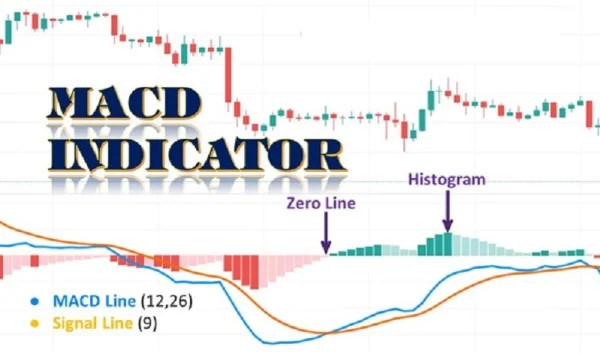
To use MACD effectively, you need to understand its four components:
1. MACD Line
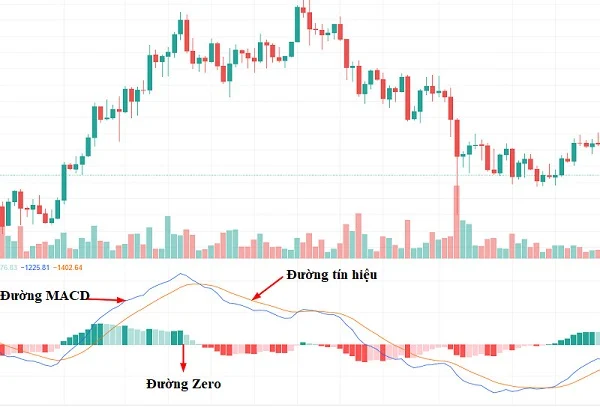
This is the most important part, representing the difference between the two EMA lines. The MACD line helps determine the market trend.
2. Signal Line
The signal line is the 9-day EMA of the MACD. When these two lines cross, it is a strong signal of a trend reversal.
3. Histogram
The histogram shows the divergence or convergence between the MACD line and the signal line, helping you spot strong trade signals.
4. Zero Line
This is the reference line that measures the strength of the market trend. When the MACD crosses this line, it signals a change in price momentum.
How to Identify and Use MACD on a Chart
Identifying the MACD Line on a Chart
On the chart, you will easily spot the MACD line in green, while the signal line is in red. When the MACD is positive, the short-term EMA is above the long-term EMA, indicating a strong uptrend. Conversely, when the MACD is negative, the short-term EMA is below the long-term EMA, signaling a downtrend.
How to Use MACD in Trading
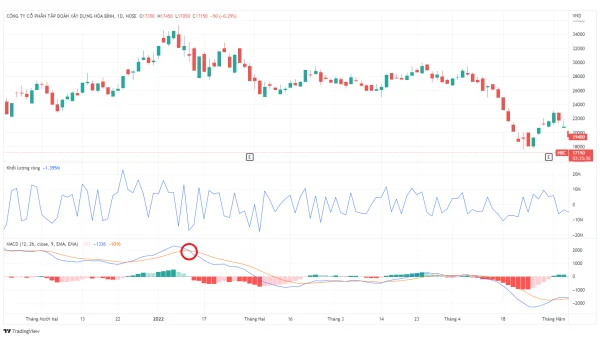
1. Crossover Points
This may sound simple, but it is very effective. When the MACD crosses below the signal line, it is time to sell. Conversely, when the MACD crosses above the signal line, a buy signal is generated.
2. Overbought/Oversold Regions
MACD can help you identify overbought or oversold regions. When the short-term EMA stretches further away from the long-term EMA, meaning the MACD increases, it indicates that the stock price has risen too much and may revert to a reasonable price level.
3. Divergence
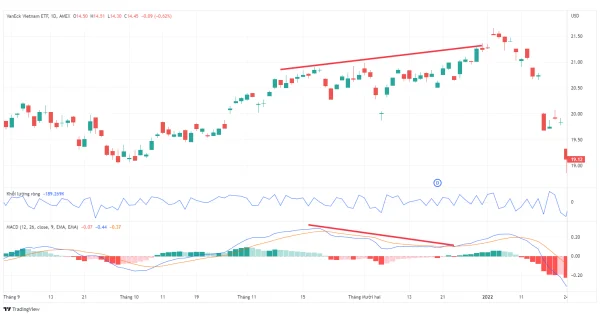
Divergence occurs when the MACD does not align with the price trend. For example, when the MACD creates a new low but the price does not, this is a warning sign that the trend may reverse.
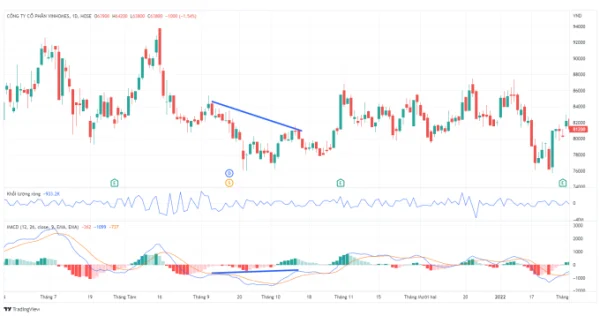
Divergence can be a strong signal, but don’t forget it can also lead to false signals, especially when it occurs in unclear market conditions. Always combine MACD with other indicators to ensure accuracy.
Trading When the Histogram Shifts
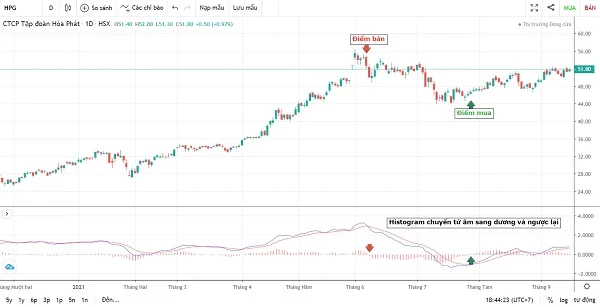
The histogram indicator helps investors visually assess trend changes. When the histogram shifts from red (negative) to green (positive), the market tends to rise, and you may consider entering a buy position. Conversely, when it shifts from green to red, it is time to prepare for a sell.
Combining MACD with Other Indicators
DLMvn always encourages using MACD in conjunction with other indicators like Stochastic or RSI to make more accurate trading decisions.
MACD and Stochastic
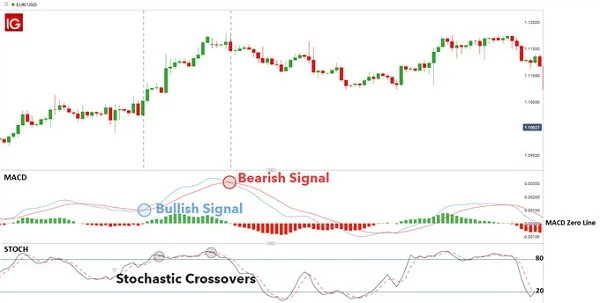
Combining MACD with the Stochastic indicator gives investors a more comprehensive view of market trends. While MACD relies on two EMA lines to identify divergence and convergence, Stochastic measures price momentum. When both indicators align, the signals they generate are much more reliable.
MACD and RSI
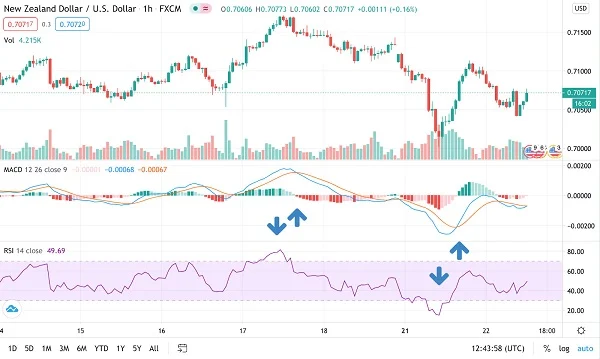
The RSI (Relative Strength Index) indicator measures the degree of price changes in recent periods, while MACD assesses the relationship between two EMA lines. When both indicators provide consistent signals, investors can proceed with trades with a higher level of confidence.
Some Limitations of MACD
Although MACD is a powerful tool in technical analysis, it still has its limitations. Divergence and convergence may warn of trend reversals, but they are not always accurate. False signals, especially in highly volatile markets, can expose investors to risks.
Additionally, MACD can lag in markets with strong fluctuations, leading to signals that arrive late compared to the actual trend. Therefore, investors should combine MACD with other indicators to minimize risk and make more accurate trading decisions.
Thus, MACD is an extremely useful tool in technical analysis, helping investors capture market trends and make informed decisions. However, this indicator is not a “holy grail” that can predict everything, so it is important to understand how to use it and combine it with other tools for the highest investment effectiveness.
MACD – The Key or the Trap?
Indeed, MACD provides clear signals when identifying trends, but never forget that in the stock market, nothing is absolute. One common issue with using MACD is the delay in its signals. Despite being a powerful tool, MACD often reacts slowly compared to market fluctuations, especially during volatile periods.
Opposite View: MACD can be considered a “lagging indicator,” meaning it relies on past data to predict future trends. This implies that if you rely solely on MACD for decision-making, you might enter a position too late, after the trend has almost completed. This is particularly dangerous in rapidly changing markets.
For example, during the 2008 financial crisis, MACD continuously generated buy signals before the market began to sharply decline. This caused many investors to get trapped, unable to react when the downtrend had already become clear.
Using MACD in Different Markets
To better understand the effectiveness of MACD, let’s look at different markets. For example, the U.S. stock market, with its high liquidity and relatively stable economic cycles, might cause MACD to work better. However, in emerging markets, which have greater volatility, MACD might not accurately reflect trends and can lead to false signals, making it harder for investors.
For instance, during fast-moving market periods, especially in the late months of the year when stocks can undergo strong adjustments due to macroeconomic factors, MACD doesn’t always perform at its best. This is why experts often advise not to rely entirely on MACD, but to combine it with other indicators for a more comprehensive view.
Challenges with MACD – Alternatives are Needed
MACD, though a prominent tool in technical analysis, is not ideal for all investors. If you are a long-term investor and don’t have time to closely follow every market fluctuation, MACD may not be the most suitable tool for you.
To address this, DLMvn suggests experimenting with combining MACD with other tools, such as momentum indicators like RSI or Stochastic. These tools can help you identify overbought/oversold levels and reduce the risks from false signals that MACD might generate.
Although MACD can help you identify trends, never rely too heavily on a single indicator. Especially when there are many macroeconomic factors at play, technical indicators like MACD can sometimes fail to reflect the true market situation accurately.
MACD and Ambiguous Signals
One reality that few people recognize when using MACD is that sometimes the convergence and divergence signals can create ambiguity, rather than making decision-making easier. In fact, many investors have encountered situations where MACD generated divergence, but the market continued in the current trend without reversing. This causes confusion and increases the uncertainty for those monitoring the indicator.
For example, over recent years, stocks of major companies like Tesla and Amazon have repeatedly generated divergence signals, but without a trend reversal as MACD had predicted. Why is this? Simply because during periods of strong growth, MACD is unable to timely reflect the market momentum, especially when the company’s fundamentals remain strong.
The Powerful Combination: MACD and Long-Term Trading Strategies
One of the most effective ways to leverage MACD is to combine it with a long-term trading strategy. This will help reduce the risk from misleading short-term signals. By combining MACD with fundamental analysis tools, you can get a more comprehensive view of the development of a company or an industry.
Specifically, when MACD signals a sell, but the fundamentals remain strong, you may choose to ignore the signal and hold the stock long-term, if you believe in the company’s future outlook. This will help you avoid panic selling when the market is simply experiencing a temporary correction.

DLMvn > Trading Indicators > Understanding MACD: The Key to Enhancing Your Investment Strategy
Tagged Articles
Exploring the Relationship Between Bollinger Bands and MACD
Expand Your Knowledge in This Area
Trading Indicators
What is the Shooting Star Candlestick Pattern? Meaning and How to Identify It
Trading Indicators
Engulfing Pattern: A Reversal Signal in Technical Analysis
Trading Indicators
Technical Analysis Indicators Groups: Understanding Their Differences and Applications
Trading Indicators
Discover How to Combine Moving Averages with Candlestick Patterns Effectively
Trading Indicators
Simple Trading Strategy with Support and Resistance
Trading Indicators
Streamlining Strategies: Mastering RSI to Maximize Profits