In the stock market, identifying and trading with trends is one of the most fundamental and effective strategies. Although there are many different trading methods, no one can deny that following trends remains the path to sustainable success. This article will help you understand how to identify a strong trend and how to apply trendlines to maximize profits in trading.
Why “The Trend Is Your Friend” in Trading?
Top traders around the world agree that no trading strategy can offer a 100% win rate. This is a given, but it is from this imperfection that we recognize the importance of finding factors that can improve the win rate. One of these factors is the trend.
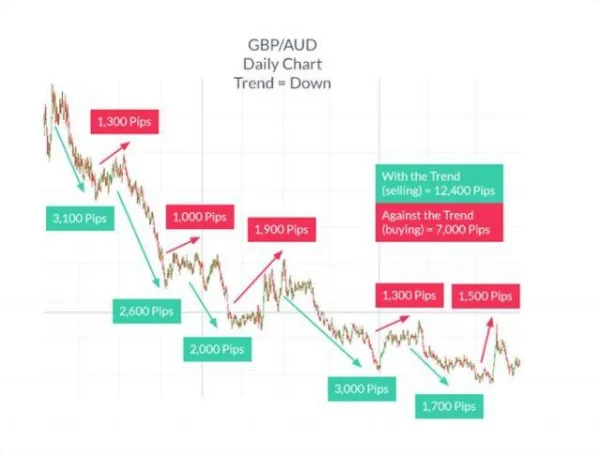
Trading with the trend is a simple yet incredibly powerful method to minimize risk in your trading strategy. Properly identifying a strong trend not only helps you trade at the right time but also reduces the risk of unexpected reversals. In fact, even when the market temporarily rises, a short trade can still yield profits if you are participating in the main trend.
To illustrate, a strong downtrend can turn losing traders into winners, of course, only if they know how to set the correct stop-loss points.
How to Identify a Trend
To identify a trend, you need to start by observing the chart of the asset you are trading. The simplest way is to look at about 100 to 200 candlesticks to determine the overall market trend.
1. Identifying an Uptrend
If the market is in an uptrend, you will notice that the peaks are consistently higher than the previous peaks, and the troughs are also higher than the previous troughs. This is a signal indicating that the trend is moving upwards strongly. We can visualize this with the following example:
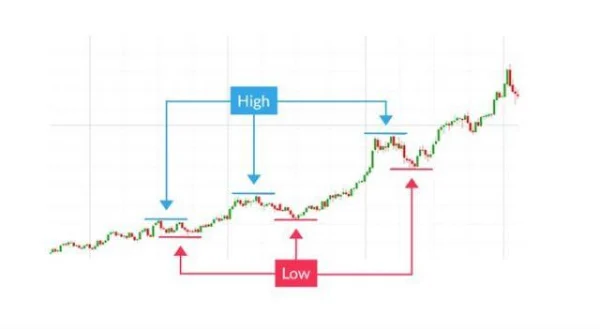
Each subsequent peak is higher than the previous one, and the troughs are also higher. This is a clear sign of a valid uptrend.
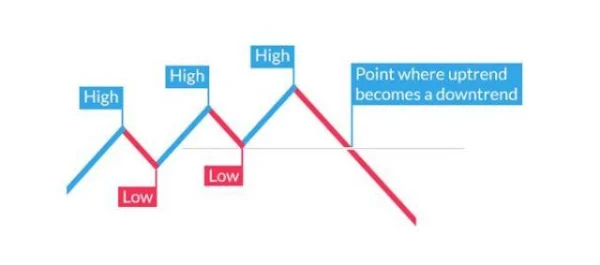
However, every trend has an endpoint. When the peaks no longer continue to rise higher than the previous peaks, and the troughs also stop rising, you might be facing a potential reversal signal.
2. Identifying a Downtrend
When the market is in a downtrend, the peaks will be lower than the previous peaks, and the troughs will also be lower than the previous troughs. A valid downtrend will look like this:
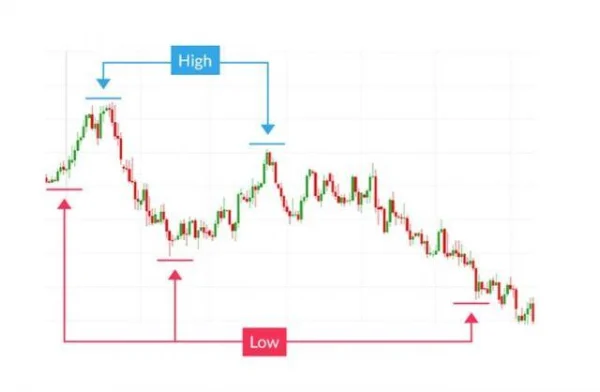
Thus, a downtrend will only end when the peaks start rising higher than the previous peaks, and the troughs begin to rise higher as well. This is when you should pay attention to a potential reversal signal.
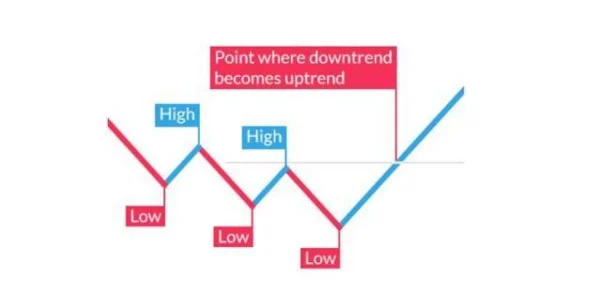
The most important thing in identifying trends is that there is no rigid rule to accurately pinpoint the peaks and troughs. However, looking for clear, easy-to-recognize examples remains the most effective approach.
3. Using Trendlines
One of the most popular tools for identifying trends is drawing trendlines. Trendlines help you easily spot areas where the market may break through trend support/resistance levels, and either reverse direction or bounce back from these trendlines.
To draw a trendline, simply connect the troughs in an uptrend or the peaks in a downtrend. A strong uptrend can be confirmed by connecting the lows, while a downtrend is confirmed by connecting the highs.
The chart below shows that entry points (buy) in an uptrend can still provide strong profits as the market continues to move in that direction. A trend will only end when there are clear signs of a reversal.
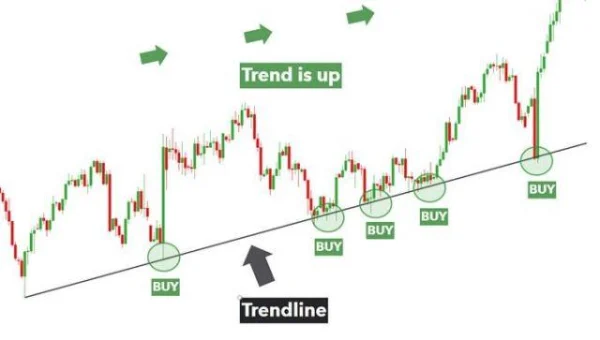
An effective strategy when trading with trends is to always look for entry points while the trend is still strong. However, always set tight stop-loss orders to protect your capital as the trend shows signs of weakening.
Traders can use trendlines to identify potential price levels where the price may reverse or continue in the current trend. Once the trendline is broken, it is a strong signal for traders to consider changing their trading strategy.
The Complexity of Trends: There Is No Absolute Formula
In reality, there are many factors that influence the market trend, and trendlines don’t always reflect these accurately. Factors such as news, political events, central bank policies, or market psychology can change a strong trend in an instant. Therefore, a trader may see a clear uptrend on the chart, but unexpected news can reverse the market, breaking the previous trend.
DLMvn wants to emphasize that identifying a trend is not an exact science, but an art that combines technical analysis and market intuition. Trendlines can provide strong signals, but only when combined with deeper analysis of the influencing factors. So, don’t just look at a trendline and treat it as the “final truth.”
DLMvn’s Contrarian Viewpoint: Some traders believe that trends are only truly valuable when “confirmed” through additional indicators such as RSI, MACD, or candlestick patterns. On the other hand, many traders feel that these tools just complicate the issue and believe that trendlines can provide strong signals without needing many additional tools.
Defining a Strong Trend: Does It Always Work That Way?
While we often hear about “strong” trends, how can we identify them? A truly strong trend is not simply one that lasts for a long time, but rather a trend that can maintain stability over a long period despite short-term fluctuations. From DLMvn’s perspective, a strong trend will have very clear signs of dominance from the buyers (in an uptrend) or the sellers (in a downtrend).
One of the key factors in identifying a strong trend is market liquidity. High-liquidity markets, such as stocks of large companies listed on the NYSE or NASDAQ, typically show stronger and clearer trends. On the other hand, low-liquidity markets may lead to strong volatility, but lack the stability needed for a long-term trend. Traders need to be cautious when trading in such markets.
This may also explain why sometimes a strong trend can suddenly reverse. For example, a large tech company’s stock might be in a strong uptrend, but a decision from management or an industry change could cause that trend to shift quickly.
The Challenges of Trading with the Trend
One of the biggest challenges in trading with the trend is misidentifying the trend. Trends can change quickly, and predicting reversal points can sometimes feel like a game of chance. Especially when the market is in a “sideways” phase (moving within a range), trendlines can become ambiguous and confusing.
1. Sudden Reversals
DLMvn has witnessed many failed trades where traders misidentified the trend simply because they placed too much trust in the trendlines drawn on the chart. One of the biggest mistakes is continuing to trade after clear signs of a reversal. To avoid this, traders should always reassess the global context, such as political events, central bank policy changes, or any other factors that may impact the market.
2. Trend Not Clear Enough
Some markets do not have a strong trend, but instead show small fluctuations and range-bound movements. In such cases, using trendlines may not be effective, and traders will need to rely on other strategies, such as range trading or using momentum indicators.
Theory vs. Reality: Is Forecasting Trends Really That Simple?
Finally, the important point that DLMvn wants to share is that the theory of trends is often not as simple as we might think. Certainly, theory suggests that the trend is your friend and that you should just follow the main trend to profit. But in reality, determining how long a trend will last is a big question.
In practice, even when you identify a trend, there is no guarantee that the trend will remain strong. Sometimes, a market may be driven by unpredictable factors, such as central bank policy changes, major political events, or macroeconomic conditions. These factors can alter the trend you are following.
Therefore, combining technical analysis with fundamental analysis remains key to successful trading. Never rely on a single factor alone, as this may cause you to miss important opportunities or make unnecessary mistakes.
While trendlines can be a useful tool, don’t forget that if you don’t understand the market context and the factors affecting the price, you could be left behind in a race where trends are always changing.

DLMvn > Trading Indicators > “Trend is Your Friend” – How to Identify a Strong Trend in the Stock Market
Expand Your Knowledge in This Area
Trading Indicators
Technical Analysis Indicators Groups: Understanding Their Differences and Applications
Trading Indicators
5 Variations of the Doji Star Candlestick Pattern
Trading Indicators
How to Identify Trendlines in Trading
Trading Indicators
What is the Shooting Star Candlestick Pattern? Meaning and How to Identify It
Trading Indicators
Discover How to Trade Using the Wedge Pattern
Trading Indicators
Piercing Line and How to Use It for Market Top/Bottom Reversal in Trading