The Pennant pattern is considered one of the most significant chart patterns in technical analysis, frequently appearing on price charts of stocks, indices, and even ETFs. However, leveraging the signals from this pattern effectively can be challenging, especially for newcomers to the market. DLMvn will provide an in-depth look at the Pennant pattern, from its definition to practical trading strategies.

What Is a Pennant Pattern?
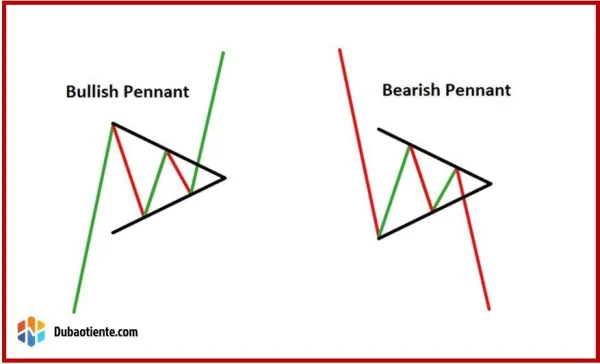
The Pennant is a continuation pattern where prices consolidate within a narrow range following a strong trend before resuming the original trend. This pattern is characterized by a compact triangular shape formed by two converging trendlines. There are two main types:
- Bullish Pennant: Appears in an uptrend.
- Bearish Pennant: Appears in a downtrend.
Unlike typical triangle patterns, a Pennant always begins with a flagpole—the strong trend preceding its formation.
Key Characteristics of the Pennant Pattern
1. The Flagpole
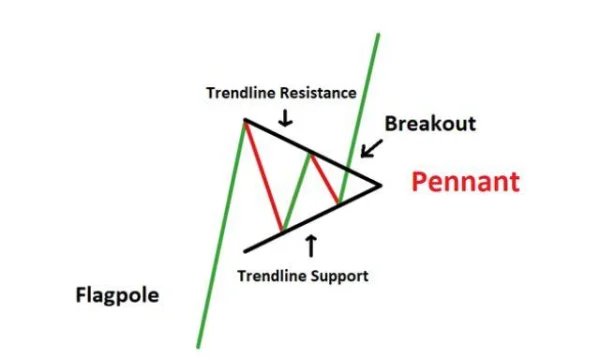
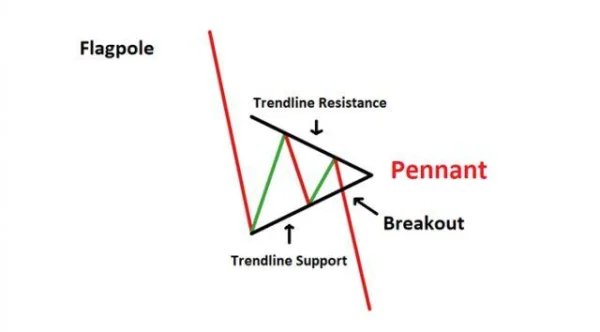
The flagpole is an essential component, representing the sharp upward or downward price movement that occurs before the Pennant pattern forms. Without a flagpole, the pattern cannot be classified as a Pennant.
2. The Pennant
The Pennant itself is a short-term consolidation zone formed by two converging trendlines, creating a small triangular shape.
3. Breakout Point
The breakout point occurs when the price breaks above resistance (in a Bullish Pennant) or below support (in a Bearish Pennant), signaling the continuation of the prior trend.
Bullish Pennant
A Bullish Pennant typically appears during a strong uptrend. After temporarily consolidating within the small triangle pattern, the price breaks out and continues its upward momentum. For example, observing the S&P 500 chart from March 2020 to August 2020 reveals several Bullish Pennant patterns that supported the recovery trend following the COVID-19 crisis.

Bearish Pennant
In contrast to the Bullish Pennant, the Bearish Pennant appears during a downtrend. Once confirmed, it usually leads to a sharp decline in price. A prime example is Tesla’s (TSLA) stock during its correction phase in early 2022, where multiple Bearish Pennants appeared on the daily chart.

Pennant vs. Triangle: Key Differences
Despite their similar shapes, there are notable differences between Pennants and Triangles:
- Flagpole: A Pennant always includes a strong preceding trend, whereas a Triangle does not require this.
- Formation Duration: Pennants are typically short-term patterns (1–3 weeks), while Triangles can extend over several months.
- Retracement Level: Pennants often have shallow retracements, usually less than 38% of the flagpole’s length.
Trading Guidelines for the Pennant Pattern
1. Entry Points
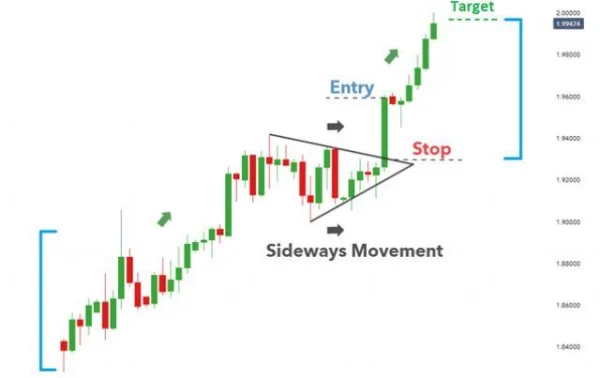
Traders should wait for a confirmed breakout candle, which usually occurs when the price closes above resistance (Bullish Pennant) or below support (Bearish Pennant).
2. Stop Loss Placement
To manage risk, place the stop loss just below the Pennant for Bullish patterns or just above for Bearish patterns.
3. Profit Target
The distance from the start of the flagpole to the base of the Pennant provides a measure for the profit target. For instance, if the flagpole is $10 tall, the expected upward or downward movement is approximately the same.

In-Depth Analysis of the Pennant Pattern
When analyzing the Pennant pattern, DLMvn identifies several key aspects that traders should consider in order to trade more effectively. In addition to using this pattern as a tool to forecast trend continuation, it is important to understand the underlying context, market psychology, and practical application.
1. The Psychological Meaning Behind the Pattern
The Pennant pattern is not just a geometric figure on the price chart, but also reflects market psychology:
- The Flagpole: Represents a period of explosive confidence (Bullish) or fear (Bearish) among investors.
- The Accumulation Zone (Pennant): Represents a market pause, where both the buying and selling sides are hesitant. Buyers are waiting for further signals to push prices higher, while sellers expect a deeper price decline.
- The Breakout Point: Is the moment when one side wins, leading to a strong continuation of the original trend.
For example, during the recovery of the Dow Jones index from October 2022, the Bullish Pennant pattern repeatedly appeared on H4 timeframes, reflecting the market’s optimism due to the US government’s economic stimulus packages.
2. Limitations of the Pennant Pattern
The Pennant pattern is not always accurate, and this has sparked considerable debate in the analysis community. Some opposing viewpoints include:
- Risk of False Signals in Weak Trends: When the initial trend is not strong or clear enough, the pattern can be mistaken for a regular triangle pattern.
- Fake Breakout Traps: During periods of low liquidity, prices often experience false breakouts, causing traders to enter positions too early and incur losses. This is particularly true for small-cap stocks or during off-hours trading in the US market.
- Lower Reliability on Short Timeframes: On timeframes such as M5 or M15, the pattern can be distorted by random fluctuations, reducing the effectiveness of the analysis.
3. Deeper Analysis Through Case Studies
A study by Thomas Bulkowski, a technical analysis expert, showed that the Pennant pattern has a relatively high success rate when applied to longer timeframes such as H4 or Daily. However, he also pointed out that:
- The breakout success rate in a Bullish Pennant is around 68%.
- The failure rate in a Bearish Pennant can be as high as 32%, especially in highly volatile markets like 2008 or 2022.
This highlights that using the Pennant pattern cannot be separated from factors like the economic context, technical indicator analysis, and news that affect market psychology.
4. Practical Insights from Global Stock Markets
Example of a Bullish Pennant – Amazon (AMZN) in 2020
During the strong growth period of Amazon (AMZN) stock in 2020, the Bullish Pennant was clearly visible on the daily chart, especially in Q2 when the COVID-19 pandemic boosted demand for online shopping.
- The Flagpole: The stock price rose from $1,900 to $2,600, an increase of over 36% within 6 weeks.
- The Pennant: The price fluctuated within a narrow range from $2,500 to $2,600 for two weeks before breaking out.
- The Breakout Point: After breaking the $2,600 level, the stock price continued to rise to $3,200, reaching the theoretical profit target.
Example of a Bearish Pennant – Facebook (Meta) in 2022
In contrast, during Meta (FB)‘s challenging period in early 2022, the Bearish Pennant appeared on the Daily chart, marking the continuation of the downtrend due to concerns about revenue growth.
- The Flagpole: The price dropped from $340 to $250 after a disappointing financial report.
- The Pennant: The price fluctuated between $245 – $260 before breaking below.
- The Breakout Point: The price continued to decline sharply to $200, exceeding the theoretical target.
5. Strategy Suggestions Combined with Other Tools
To increase accuracy when trading with the Pennant pattern, DLMvn suggests that traders combine it with:
- RSI: To identify overbought or oversold conditions before a breakout.
- MACD: To check the crossing of signal lines for trend confirmation.
- Volume: A surge in volume at the breakout point is a strong signal for the validity of the pattern.

DLMvn > Trading Indicators > Techniques for Using the Pennant Pattern in Stock Market Investing
Expand Your Knowledge in This Area
Trading Indicators
Piercing Line and How to Use It for Market Top/Bottom Reversal in Trading
GlossaryTrading Indicators
Stochastic Oscillator: An Effective Tool For Forecasting Market Trends
Trading Indicators
What is the Shooting Star Candlestick Pattern? Meaning and How to Identify It
Trading Indicators
Mastering the Morning Star Candlestick to Conquer the Market
Trading Indicators
Discover John Bollinger’s Bollinger Band Rules for Successful Trading
Trading Indicators
How to Effectively Use Harmonic Price Patterns in Trading and Investing