If you’re seeking a simple yet effective trading method, the Morning Doji Star is a pattern worth exploring. As an investor, leveraging this pattern can provide reliable trading signals, especially in suitable market contexts.
What is the Morning Doji Star?
The Morning Doji Star is a three-candlestick bullish reversal pattern, with a critical confirmation condition: the third candlestick must close in the upper half of the first candlestick. Essentially, this pattern resembles a strong reversal pinbar but is reinforced by its three-candlestick structure, giving traders more confidence in their decisions.
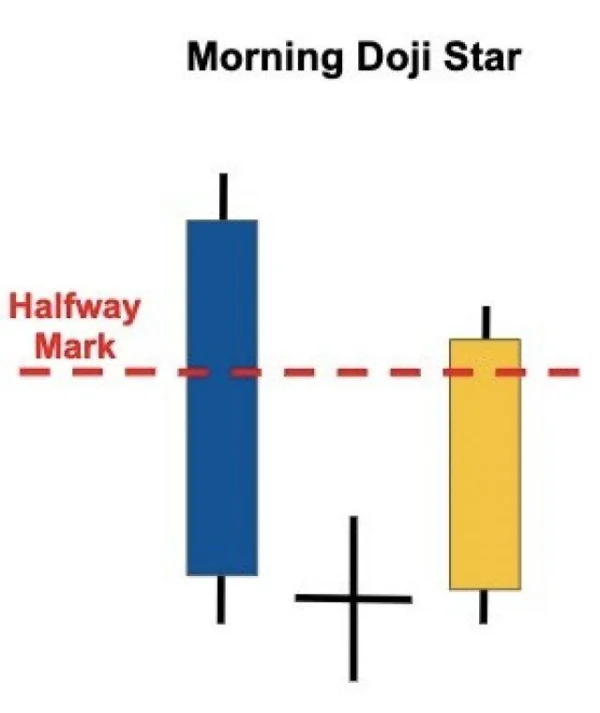
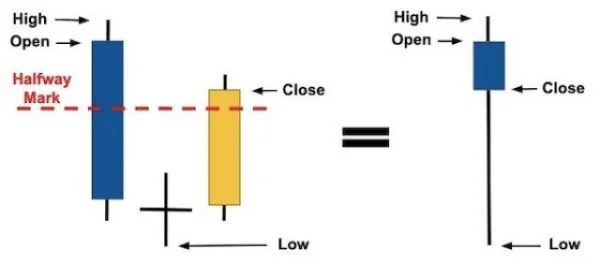
Combining candlesticks for simplicity: If you merge the three candles of the Morning Doji Star, it forms a long bullish candlestick with a small lower shadow, indicating strong buying momentum. This characteristic makes the Morning Doji Star a reliable reversal signal.
Where Does the Morning Doji Star Appear?
This pattern is not limited to downtrends for bullish reversals but can also appear in uptrends, making it versatile and adaptable to various trading strategies.
Appearing in Uptrends
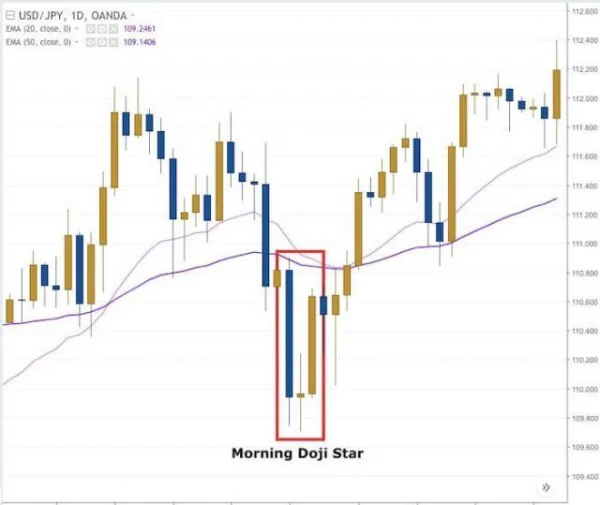
In an uptrend, the Morning Doji Star often emerges after a slight price pullback to the EMA 20 or EMA 50 zones. Imagine a chart where prices consistently oscillate above these EMAs. During a minor retracement, the Morning Doji Star appears, and prices resume their upward movement. This signals that buying momentum has returned after a brief pause.
How to Trade with the Morning Doji Star
There are several ways to trade with this pattern, but here are three of the most popular strategies:
1. Trading with a Double Bottom
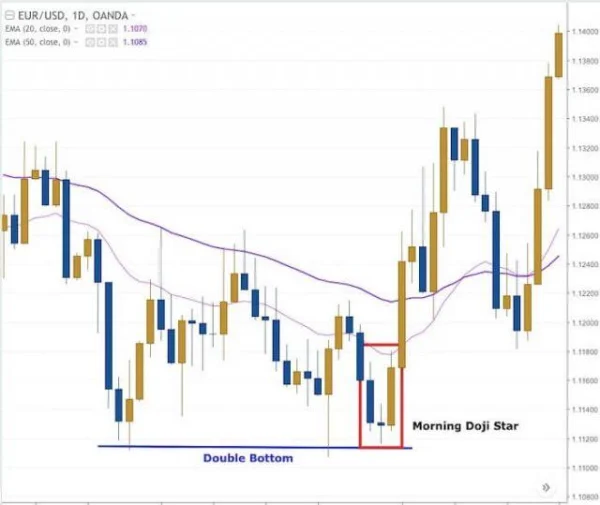
The double bottom is one of the most reliable bullish reversal patterns. When a Morning Doji Star appears at the second bottom, the buy signal becomes extremely robust.
For example, suppose you observe the market retesting a significant support level. The first bottom forms, followed by a slight price increase. On the second test of the support level without a break, a Morning Doji Star forms, with the third candle closing above the first candle’s high. This is a clear signal of the buyers’ return.
Execution steps:
- Entry point: When the third candlestick of the Morning Doji Star closes.
- Stop loss: Place it just below the pattern’s low.
- Profit target: Based on the distance from the pattern’s high to low, then double it.
2. Trading with a V-Bottom
The V-Bottom is a rare but powerful pattern. When a Morning Doji Star coincides with a V-Bottom, the trading opportunity offers a high risk-reward ratio.
For instance, imagine a strong support zone where prices drop rapidly, forming a V-shaped bottom, and then rebound. During this process, a Morning Doji Star appears at the V’s base, reinforcing the reversal signal.
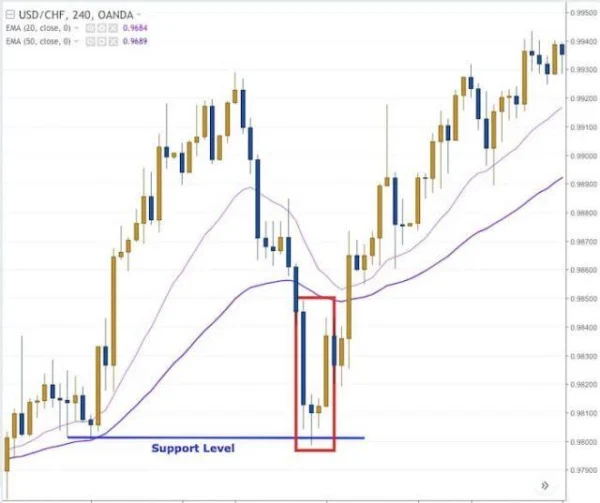
Execution steps:
- Entry point: When the price breaks above the Morning Doji Star’s high.
- Stop loss: Place it below the V-Bottom’s low.
- Profit target: Depending on the V’s height, aim for 2-3 times this distance.
3. Trading with Bullish Divergence
Bullish divergence is an excellent way to combine the Morning Doji Star with technical indicators like Stochastic or RSI. Divergence occurs when prices form a lower low while the indicator forms a higher low, signaling weakening selling pressure.
Imagine observing the market creating two consecutive lows, with the second being lower. However, Stochastic shows a higher low. Simultaneously, a Morning Doji Star forms at the second low, marking a highly significant reversal signal.
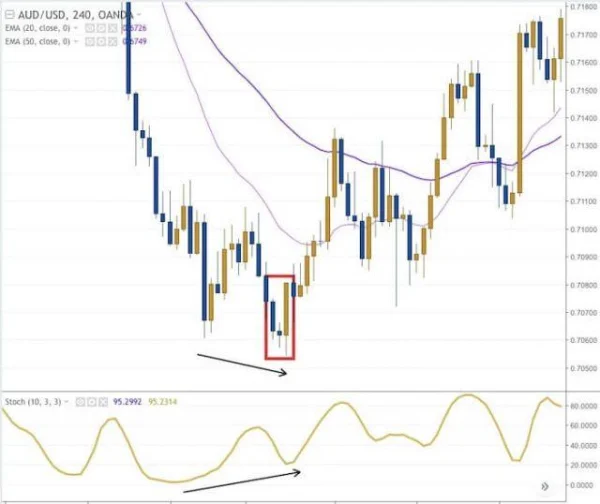
Execution steps:
- Entry point: After the third candlestick of the Morning Doji Star completes.
- Stop loss: Place it below the second low.
- Profit target: Aim for nearby resistance levels or use a minimum R:R ratio of 2:1.
When trading with the Morning Doji Star, always remember that market context is key. Even the strongest candlestick signal becomes meaningless in unfavorable market conditions.
In-Depth Insights into the Morning Doji Star
The Morning Doji Star candlestick pattern is not just a simple technical tool but also carries profound messages about market psychology. Below are insights and additional analyses to help readers fully understand both the strengths and limitations of this pattern.
Morning Doji Star – A Reflection of Market Psychology
The Morning Doji Star not only signifies price reversals but also reflects the tug-of-war between buyers and sellers.
- First candle: Sellers dominate the market, driving prices sharply lower and forming a strong bearish candle. This often corresponds with investors’ pessimism and fears of further declines.
- Second candle: The market stalls, forming a Doji candle, indicating hesitation. This is when sellers begin to lose momentum, and buyers start to counteract.
- Third candle: Buyers take clear control, pushing prices higher, with the candle closing in the upper half of the first candle. This confirms the reversal from bearish to bullish.
On a deeper level, the Morning Doji Star highlights the shift in market control from panic to optimism. This underscores the pattern’s role in providing valuable insights into crowd psychology.
Limitations of the Morning Doji Star
Despite its strong signals, the Morning Doji Star has several limitations that you should be aware of:
- Dependent on market context: If the pattern appears in a weak trend or a sideways market, the signal may be less reliable.
- Lagging signal: The Morning Doji Star requires three candles to form, which means you might miss the optimal entry price. This necessitates balancing between waiting for confirmation and the risk of losing opportunities.
- Low reliability without additional tools: A standalone Morning Doji Star is not sufficient for trading decisions. It should be combined with factors such as support/resistance levels, EMAs, or other technical indicators.
Contrary Views: Is the Morning Doji Star Truly “Powerful”?
Some argue that while the Morning Doji Star is strong, it’s not a “holy grail” in trading. Certain investors prefer simpler patterns like the pinbar or engulfing pattern because they are easier to recognize and provide quicker signals.
Additionally, using the Morning Doji Star in non-trending markets may lead to false signals. Imagine this: if the pattern appears during a prolonged sideways phase, a breakout might only be a “false breakout.” This highlights the need to use the Morning Doji Star in close conjunction with other contextual factors.
Risk Management Strategies
Experienced investors understand that no signal is 100% foolproof. Therefore, when trading with the Morning Doji Star, you should have a solid risk management strategy.
“Always use a stop loss and never trade with your entire capital at once.”
For example, if you spot a Morning Doji Star forming but are unsure about the strength of the signal, reduce your trade size or wait for an additional candle to confirm the trend direction. This minimizes the risk of significant losses if the market moves against your prediction.
Morning Doji Star Compared to Other Patterns
An interesting question is: what advantages does the Morning Doji Star have over other candlestick patterns such as Engulfing or Hammer?
- Compared to Engulfing: The Morning Doji Star is more complex, but its three-candle structure often provides more reliable reversal signals. Engulfing patterns are better suited for traders who prefer simplicity and faster action.
- Compared to Hammer: The Hammer delivers quicker and easier-to-spot signals but lacks the confirmation that the Morning Doji Star offers.
Ultimately, choosing which pattern to use depends on your trading style and risk tolerance.
A Practical Tip
There’s an unwritten rule when trading candlestick patterns: never overlook the overall market context. Imagine driving on a busy road. The Morning Doji Star is like a road sign, but to follow the right path, you need to know where you are on the map (market context).
DLMvn once observed a perfect Morning Doji Star in a strong downtrend. Instead of reversing, the price continued to drop further. Why? Because there was no support from EMA lines or strong support zones. This emphasizes that no matter how beautiful a pattern may look, it needs to be placed in the proper context to be effective.

DLMvn > Trading Indicators > Profiting from the Morning Doji Star Candlestick Pattern
Tagged Articles
Mastering the Morning Star Candlestick to Conquer the Market
An Introduction to the 5 Doji Candle Patterns
5 Variations of the Doji Star Candlestick Pattern
Expand Your Knowledge in This Area
Trading Indicators
How to Identify Rectangle Patterns in Trading
Trading Indicators
Simple Trading Strategy with Support and Resistance
Trading Indicators
10 Candlestick Patterns Every Trader Should Know
Trading Indicators
Streamlining Strategies: Mastering RSI to Maximize Profits
Trading Indicators
Discovering Elliott Wave Theory: The Foundation of Market Forecasting Art
Trading Indicators
Discover How to Trade Using the Wedge Pattern