Pivot Points are a popular technical analysis tool used by many traders to identify key support and resistance levels, helping them make more accurate trading decisions. However, despite being a simple yet powerful tool, understanding and using Pivot Points correctly can be challenging. DLMvn will guide you through how to identify Pivot Points and effective trading methods with this indicator.
What is a Pivot Point?
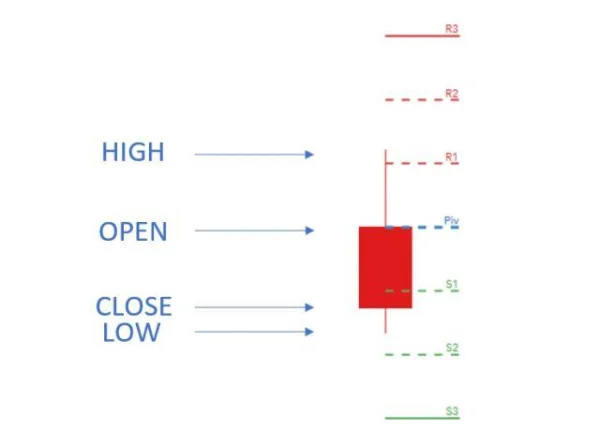
A Pivot Point is a technical indicator that helps identify key support and resistance levels on a price chart. They are calculated using the previous period’s high, low, and close prices. Traders use Pivot Points to determine target price levels for entry, stop loss, and take profit. Specifically, they provide an overview of trend reversals and market reactions.
How to Trade with Pivot Points
When the price is above the Pivot Point, the market tends to be bullish, and conversely, if the price is below the Pivot Point, the trend may be bearish. Pivot Points on longer timeframes are generally more reliable because they use a larger amount of data.
Common Types of Pivot Points
- Classic Pivot Points
- Camarilla Pivot Points
- Woodies Pivot Points
Pivot Point Calculation Formula
- Pivot Point (PP) = (High + Low + Close) / 3
- Resistance 1 (R1) = PP x 2 – Previous Low
- Support 1 (S1) = PP x 2 – Previous High
- Resistance 2 (R2) = PP + (R1 – S1)
- Support 2 (S2) = PP – (R1 – S1)
- Resistance 3 (R3) = High + 2(PP – Low)
- Support 3 (S3) = Low – 2(High – PP)
How to Trade with Classic Pivot Points
1. Filter Price Action Based on Trend
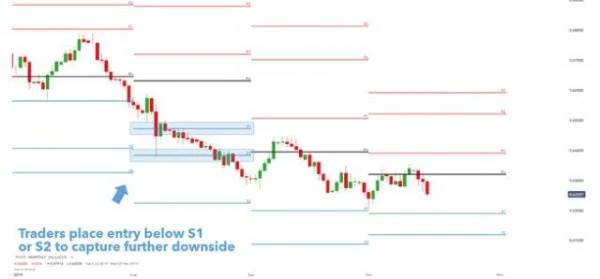
As shown in the example below, S1 and S2 (marked in blue) act as support levels in a downtrend. Traders can open short positions when the price breaks through these levels to profit from the downward price movement.
2. Classic Pivot Points Provide Attractive Entry Opportunities
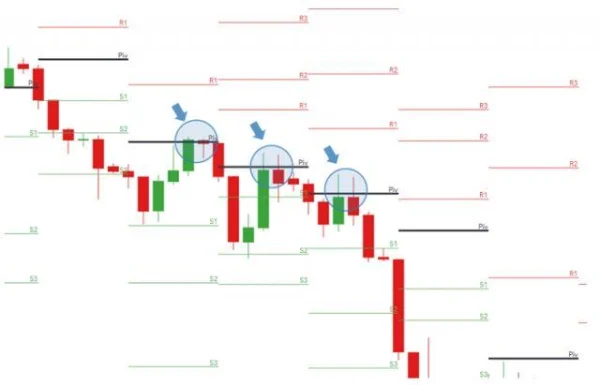
The chart below illustrates a current downtrend, where the price retraces to the Pivot Point before continuing to decline. This is an ideal opportunity for traders to enter a short position when the price touches the Pivot Point and drops.
3. Use Pivot as Dynamic Support and Resistance Levels
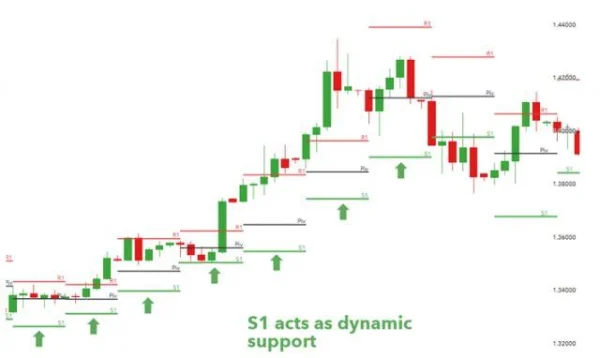
As seen in the GBP/USD chart below, when the price increases, the S1 level also rises, and traders can adjust their stop levels accordingly. This helps optimize trading strategies in volatile markets.
Camarilla Pivot Points
Camarilla Pivot Points offer a different calculation formula compared to Classic Pivot Points, providing more precise support and resistance levels in strong trends.
Camarilla Pivot Point Calculation Formula
- Pivot Point (PP) = (High + Low + Close) / 3
- Resistance 1 (R1) = Closing + ((High – Low) x 1.0833)
- Support 1 (S1) = Closing – ((High – Low) x 1.0833)
- Resistance 2 (R2) = Closing + ((High – Low) x 1.1666)
- Support 2 (S2) = Closing – ((High – Low) x 1.1666)
- Resistance 3 (R3) = Closing + ((High – Low) x 1.2500)
- Support 3 (S3) = Closing – ((High – Low) x 1.2500)
- Resistance 4 (R4) = Closing + ((High – Low) x 1.5000)
- Support 4 (S4) = Closing – ((High – Low) x 1.5000)
How to Trade with Camarilla Pivot Points
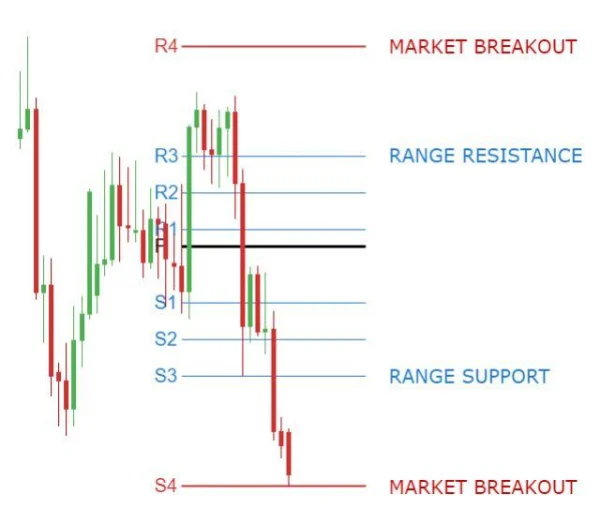
1. Camarilla Pivot Range Strategy
In sideways market conditions, traders can use Camarilla Pivot to identify the trading range. When the price breaks through Camarilla’s support and resistance levels, traders can open long or short positions depending on the price movement.
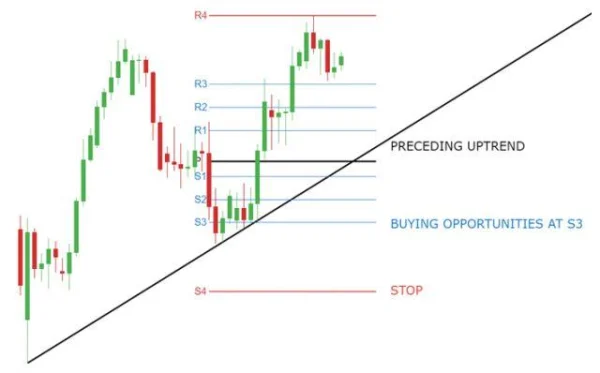
2. Camarilla Pivot Trend Strategy
In trending markets, Camarilla Pivot helps traders find entry points with clear stop loss and take profit levels. If the market is trending upward, traders will buy near S3 and set the stop loss at S4. Conversely, if the market is in a downtrend, they will sell at R3 and set the stop loss at R4.
Woodies Pivot Points
Woodies Pivot is another variation of the Pivot Point, with slightly different calculation formulas compared to other types of Pivot Points. It is commonly used in day trading strategies and provides clear signals for identifying support and resistance areas.
Woodies Pivot Points Calculation Formula
- Pivot Point (PP) = (High + Low + Close) / 3
- Resistance 1 (R1) = PP x 2 – Previous Low
- Support 1 (S1) = PP x 2 – Previous High
- Resistance 2 (R2) = PP + (High – Low)
- Support 2 (S2) = PP – (R1 – S1)
- Resistance 3 (R3) = High + 2 x (PP – Low)
- Support 3 (S3) = Low – 2 x (High – PP)
How to Trade with Woodies Pivot Points
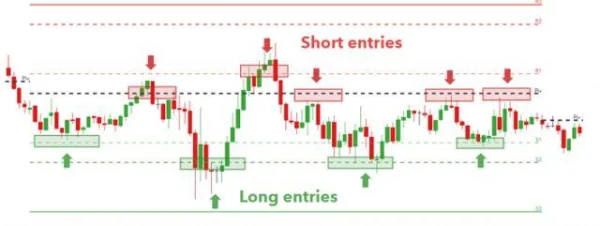
1. Intraday Trading Strategy
With Woodies Pivot, traders can day trade with nearby support and resistance levels. The chart below shows long and short trading opportunities within price ranges where there is less volatility.
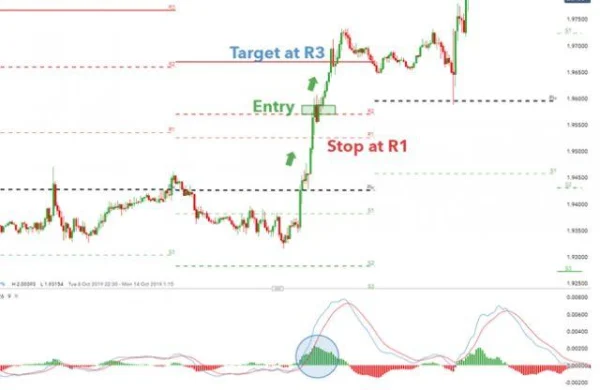
2. Momentum Breakout Trading Strategy
An important strategy when using Woodies Pivot is to catch breakouts with strong momentum. The chart below shows price breaking out of its normal trading range, and traders will capitalize on this strong movement to open long or short positions.
Advantages and Disadvantages of Using Pivot Points
Advantages
- Supports short-term trading: Pivot Points are highly effective for short-term traders or day traders.
- Risk management: Clear support and resistance levels help traders manage risk better.
- Applicable to various assets: Pivot Points can be applied to different markets, from stocks to commodities.
Disadvantages
- Not suitable for long-term trading: Pivot Points are not ideal for long-term traders.
- Challenging for beginners: To use Pivot Points effectively, traders need experience and a solid understanding of trading strategies.
- Risk of loss if used incorrectly: If traders misunderstand the signals, they can make mistakes and incur significant losses.
In-Depth Look at Pivot Points
1. Effectiveness of Pivot Points in Highly Volatile Markets
In periods of high market volatility, Pivot Points can provide important signals regarding support and resistance points, helping traders make more accurate trading decisions. However, this does not mean that Pivot Points always guarantee success. A clear example of this is during the 2008 global financial crisis, when support and resistance levels defined by Pivot Points were breached during massive sell-offs.
2. Dependence on Time Frame and Data Volume
When trading on longer time frames, Pivot Points are generally more reliable as they use data from multiple trading days. For example, in the case of the S&P 500 index, looking at Pivot Points on a weekly chart, traders can identify stronger support and resistance points compared to those on a daily chart. This is partly because the volatility in long-term stock markets tends to be lower, making these price levels stronger indicators.
However, it is important to note that even on longer time frames, Pivot Point signals can be skewed if there is a significant news event or unexpected market fluctuations, such as financial or political crises. These factors often cause the market to “break” and make the support and resistance levels from Pivot Points unreliable.
3. Importance of Support and Resistance Levels Defined by Pivot Points
In practice, some traders use the support and resistance levels created by Pivot Points not only for entry points but also for risk management.
However, Pivot Points are not always the best tool for every trader. In highly volatile markets or when support/resistance levels are created by breaking news, Pivot Point levels may not reflect the true market conditions. A clear example of this is when Tesla’s stock price in 2021 surpassed the resistance level set by Pivot Points without following the overall market trend, which caused many traders relying on Pivot Points to face difficulties in taking profits.
Contrarian View on Pivot Points
Although Pivot Points are an effective technical analysis tool, it cannot be denied that they have limitations. One contrarian view is that these price levels can become inaccurate when the market lacks a clear trend or when applied during unstable periods.
Some professional traders believe that the support and resistance levels from Pivot Points are vulnerable to being breached if the market experiences unexpected factors. In fact, events like quarterly earnings reports, central bank policy meetings, or macroeconomic news can trigger sudden trend changes, making Pivot Point levels irrelevant.
A clear example of this occurred during the Nasdaq 100 trading session in March 2020, when the stock market dropped sharply due to the pandemic, and Pivot Point levels could not predict this sudden change.

DLMvn > Trading Indicators > Pivot Points: How to Identify Support and Resistance Levels
Tagged Articles
Comprehensive Guide to Pivot Point: The Secret to Stock Market Analysis
Expand Your Knowledge in This Area
GlossaryTrading Indicators
Stochastic Oscillator: An Effective Tool For Forecasting Market Trends
Trading Indicators
Hanging Man: A Reversal Candlestick Pattern
Trading Indicators
Comprehensive Guide to Pivot Point: The Secret to Stock Market Analysis
Trading Indicators
Engulfing Pattern: A Reversal Signal in Technical Analysis
Trading Indicators
Discover How to Combine Moving Averages with Candlestick Patterns Effectively
Trading Indicators
Discover John Bollinger’s Bollinger Band Rules for Successful Trading