Pitchfork, a tool developed by Dr. Alan Andrews, has become an indispensable part of the toolkit for many professional traders. DLMvn has previously applied it in their trades and found it to be a powerful tool for identifying support and resistance levels, and especially for pinpointing price zones that may change the market trend. In this article, DLMvn will explore the benefits of using Pitchfork in trading and how to apply it effectively.
What is Andrews’ Pitchfork?
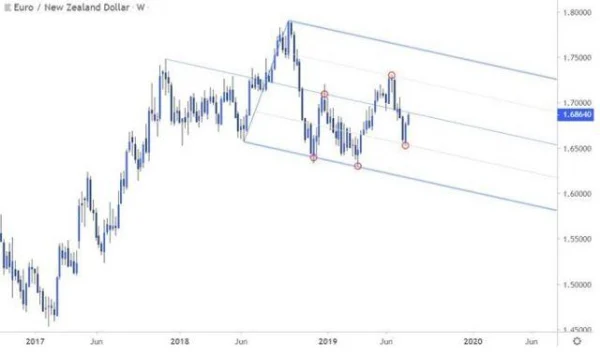
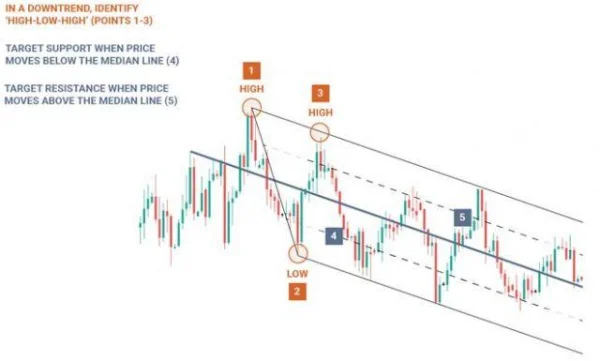
Pitchfork, developed by Dr. Alan Andrews, is a highly influential tool in the development of technical analysis tools. This tool is mainly used to identify price channels and market structures. Pitchfork helps to determine potential support and resistance levels, providing insights into potential trend changes. The image below illustrates an example of how Pitchfork is used.
What is the Median Line?
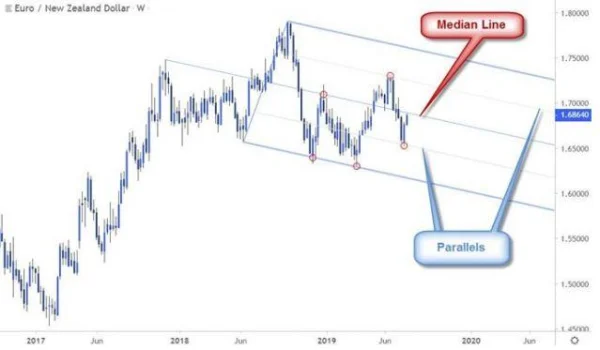
One of the key elements in Andrews’ Pitchfork is the median line (also known as the central line). This is a straight line located in the middle, running through significant points of the market, and serves as a tool for identifying changes in trends. Two parallel lines to the median line act as support (if located below) and resistance (if located above). When the price crosses the median line, the trend’s target changes and follows the direction of the corresponding parallel line.
How to Trade with Pitchfork and the Median Line
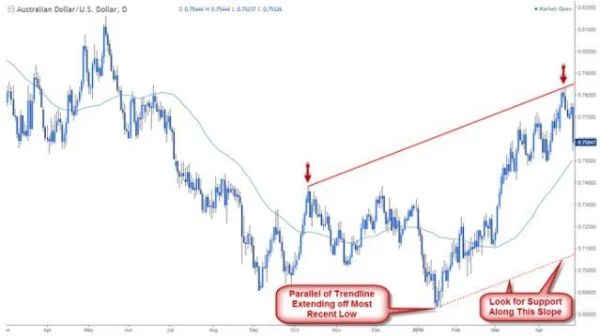
To begin trading with Pitchfork, DLMvn recommends getting familiar with how to draw trendlines. First, you need to identify an initial trendline – it could be a support or resistance line. Then, from there, create a parallel line to define the trend channel, which will serve as the basis for identifying the next support and resistance levels. This trend channel will help you observe the market’s direction, and in turn, determine appropriate entry points.
1. Using Trendlines in Pitchfork
Let’s consider a real-life example with the EUR/USD currency pair. In early 2016, a clear trendline was formed connecting two peaks, and the price then reacted with a parallel support line. These reaction points are crucial because they indicate price zones that could reverse or continue the current trend. When the price approaches one of Pitchfork’s parallel lines, traders can anticipate a trend change.
2. Using the Median Line and Reaction Levels
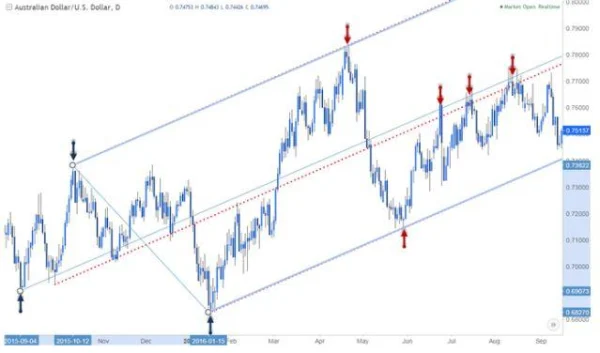
When applying the median line, DLMvn has observed that every time the price approaches this line, a reversal can be expected. For instance, on the AUD/USD chart, in June, the price rebounded as it approached the lower parallel line of Pitchfork, then created a clear upward trend. This proves that the median lines and parallel levels are very useful in identifying pivot points – potential entry points for trades.
How to Draw Pitchfork
Drawing Pitchfork requires accuracy in selecting reference points. DLMvn always emphasizes that in an uptrend, you should select reference points as low-high-low. Meanwhile, in a downtrend, the reference points should be high-low-high. This is an important step in determining the slope of the Pitchfork lines and predicting the next market trend.
1. Drawing Pitchfork in an Uptrend
When drawing Pitchfork in an uptrend, pay attention to the low and high points, then draw parallel lines to these points. This helps identify price zones where a reversal could occur or the trend could continue.
2. Drawing Pitchfork in a Downtrend
For a downtrend, selecting the right reference points is crucial. You will need to draw high-low-high points to create a downward sloping Pitchfork. These will help identify support and resistance zones, as well as predict the next trend.
Factors to Consider When Using Pitchfork
When trading with Pitchfork, it is important to identify the price reaction points to the median line. This is a key factor in assessing the accuracy of this tool. It’s also essential to remember that sometimes you will need to adjust the low and high levels to match the current market conditions.
When the price exits the price channel, DLMvn advises you to adjust and redraw the Pitchfork in the opposite direction. If the price breaks below the lower parallel line of an upward Pitchfork, you need to find new reference points based on the high-low-high pattern in the short term. Conversely, if the price breaks above the upper parallel line of a downward Pitchfork, you need to identify a new low-high-low level.
Pitchfork – A Powerful Tool, But Also Challenging
Although Pitchfork is widely used by traders for technical analysis and trading, it is undeniable that this tool also has drawbacks that should be considered. DLMvn has encountered numerous instances where, even when using Pitchfork, unexpected trend changes occurred that the tool could not predict accurately. Sometimes, reaction points are unclear, or the market moves unpredictably, making the signals ambiguous.
1. Does Pitchfork Guarantee Success?
One of the major issues when trading with Pitchfork is that it is not always accurate. Along with other tools like Fibonacci, momentum indicators, or chart patterns, Pitchfork can sometimes produce false signals, especially during periods when the market lacks a clear trend. Take the market event in December 2018 as an example, when the Dow Jones Industrial Average experienced significant volatility. Despite signals from Pitchfork indicating an uptrend, a sharp short-term decline actually occurred. This is a clear demonstration that no analytical tool is perfect.
Moreover, many traders sometimes do not accurately follow the steps required to determine the correct slope of the Pitchfork, leading to incorrect predictions. Therefore, before making any trading decisions, you must recognize and understand that Pitchfork will not always give you an accurate result.
2. Why Should Pitchfork Be Combined with Other Tools?
Recent studies have shown that combining Pitchfork with other tools like the MACD indicator, RSI, or candlestick patterns can improve the accuracy of entry points. For example, in a 2020 study of the US stock market, combining Pitchfork with the RSI indicator helped identify buy points at low support levels, minimizing risk and providing higher returns. Using these indicators in an integrated trading strategy helped traders reduce the mistakes that Pitchfork could produce in unstable market conditions.
Furthermore, this also highlights the flexibility of Pitchfork. While it is a powerful tool, you should not rely solely on it and ignore other signals. Professional traders never use only one tool in their strategy; they always combine multiple analysis tools to make smarter decisions.
3. Global Stock Markets: A Story of Complex Realities
DLMvn wants to take the US stock market as a specific example to better understand the market shifts and the impact of technical analysis tools like Pitchfork. In 2020, when the global stock markets experienced sharp declines due to the Covid-19 pandemic, tools like Pitchfork failed to reflect the sudden market changes. In the early months of 2020, when investors used Pitchfork to analyze trends, they may have made incorrect predictions because the price patterns were too complex and unpredictable.
Another example from the Japanese stock market also shows that Pitchfork is not always easy to apply. In the 2017-2018 period, the Nikkei 225 index experienced significant fluctuations but did not follow a clear trend. Although traders used Pitchfork to predict reversal points and support levels, the results were not as expected. Economic shocks during this period, along with external factors affecting the market, reduced the effectiveness of these technical indicators.
4. A Detailed Analysis of Price Patterns
One important thing when using Pitchfork is to clearly understand the price pattern that the tool is reflecting. DLMvn always emphasizes that correctly identifying reference points and price patterns is the key to successful trading.
For example, when using Pitchfork to analyze the EUR/USD pair in 2019, recognizing reversals at median lines helped traders enter trades at the right time. However, it is important to note that reversals do not always occur exactly at the median line but may happen at parallel support or resistance levels.
Therefore, when using Pitchfork, don’t focus solely on one signal but always combine it with price pattern analysis and other indicators. Experienced traders know how to assess these signals holistically and make more accurate trading decisions.
5. Personal Experience with Using Pitchfork
Throughout my trading journey, DLMvn has encountered situations where Pitchfork only reflected the trend for a short period before the market reversed. This has helped DLMvn realize that applying Pitchfork effectively not only requires drawing trend lines correctly but also the ability to adapt to market changes. The stock market doesn’t always follow a straight and clear path, so flexibility in adjusting your trading strategy is essential.
6. Combining Other Analysis Methods
DLMvn recommends that instead of relying solely on Pitchfork, try combining it with other analysis methods like Fundamental Analysis or Price Action Analysis for a more comprehensive view of the market. For example, when predicting a stock’s growth, besides considering the support and resistance points of Pitchfork, you should also analyze fundamental factors like company earnings, financial reports, and macroeconomic factors that may influence the market.
If you do this, you will not only rely on one tool but can build a strong and comprehensive trading strategy that will help you achieve better results.

DLMvn > Trading Indicators > Pitchfork and Its Key Benefits in Trading
Expand Your Knowledge in This Area
Trading Indicators
What Are Lagging Indicators? A Comprehensive Guide And Practical Applications
Trading Indicators
Piercing Line and How to Use It for Market Top/Bottom Reversal in Trading
Trading Indicators
How to Identify Trendlines in Trading
Trading Indicators
Essential Technical Indicators Every Trader Should Master
Trading Indicators
Pivot Points: How to Identify Support and Resistance Levels
Trading Indicators
Three Inside & Outside Up Candlestick Patterns: Bullish Reversal Signals