TABLE OF CONTENTS
- What Is the Evening Star Candlestick Pattern?
- How to Identify the Evening Star
- Evening Star Doji
- How to Trade Using the Evening Star
- Advantages and Disadvantages of Trading with the Evening Star
- In-Depth Analysis of the Evening Star Pattern
- Limitations of Applying the Evening Star in Trading
- Effective Combination Strategies
What Is the Evening Star Candlestick Pattern?
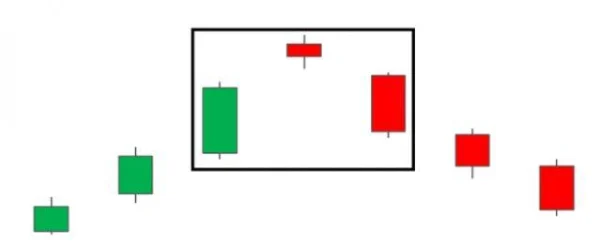
The Evening Star candlestick pattern is a powerful tool used by investors worldwide to predict market reversals. This is a three-candlestick pattern, typically appearing at the end of an uptrend, signaling that bullish momentum is weakening before the market transitions into a downward phase. What makes this pattern valuable is not only its easy identification but also its ability to provide clear actionable signals.

How to Identify the Evening Star
Understanding and accurately identifying the Evening Star pattern is not just about spotting three consecutive candlesticks on a chart. To truly master it, you need to grasp the surrounding market context and accompanying price action. Let’s break it down step by step:
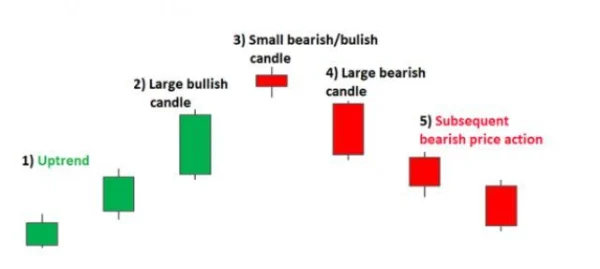
1. Identify the Current Uptrend
The Evening Star pattern is only reliable if it appears after a clear upward trend. This requires you to thoroughly evaluate the preceding candlesticks to ensure that the market is genuinely in a strong bullish phase.
2. First Candle: Strong Bullish Momentum
The first candlestick in the pattern is typically a large bullish candle, reflecting market enthusiasm. At this stage, buying pressure dominates, and investors often prioritize maintaining long positions.
3. Second Candle: Indecision Appears
This could be a small candlestick or a Doji. The key feature of this candle is indecision, as buying pressure starts to wane but the bears have yet to take control. This hesitation is the first sign that bullish momentum may be exhausted.
4. Third Candle: Bears Take Control
The final bearish candle in the pattern confirms the reversal. Selling pressure drives the closing price significantly lower, validating the onset of a downtrend.
5. Monitor Post-Pattern Price Action
Once the Evening Star forms, tracking subsequent highs and lows is essential. Pay close attention to risk management by placing stop-loss orders at reasonable levels.

Evening Star Doji
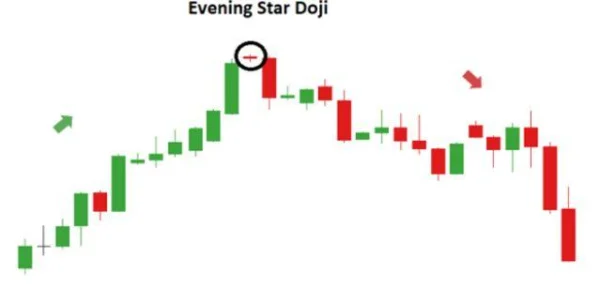
In some cases, the second candle in the Evening Star pattern is a Doji. This occurs when the opening and closing prices are nearly identical, creating a small cross-like figure on the chart. The appearance of a Doji indicates market indecision, with buyers unable to push prices higher. This often serves as a strong signal for a potential reversal.

How to Trade Using the Evening Star
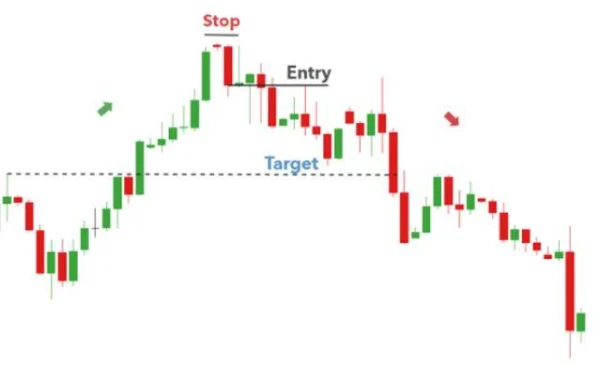
The Evening Star pattern can be effectively applied across various markets, from equities to futures. For a clearer understanding, let’s examine the EUR/GBP chart:

Pattern Confirmation
When the three candlesticks complete the Evening Star pattern, you may consider entering a short position at the open of the next candle. However, if you prefer a cautious approach, continue observing the price action for further confirmation.
Setting Targets and Stop-Loss Levels
Price targets are usually set at the nearest support levels. Conversely, stop-loss orders should be placed above recent highs to protect your capital if the market moves against your expectations.
Maintain a Favorable Risk/Reward Ratio
Maintaining a positive risk/reward ratio (at least 2:1) is crucial for long-term profitability. Remember, there are no guarantees in the market, and risk management should always be a top priority.
Combine the Evening Star pattern with technical indicators such as RSI or MACD to enhance reliability. For example, if the RSI is in overbought territory when the Evening Star appears, the likelihood of a reversal increases significantly.
Advantages and Disadvantages of Trading with the Evening Star
Advantages
- Easy to recognize due to its simple structure.
- Frequently appears, especially on shorter timeframes like H1 or H4.
- Provides clear signals for both entry and exit points.
Disadvantages
- The pattern is not always accurate, especially without supportive market context.
- In some cases, prices may continue to rise despite the reversal signal, posing high risks for short positions.
- Requires combination with other analytical tools to avoid false signals.
(Image description: The Evening Star pattern appears on the EUR/GBP price chart with the RSI indicator, clearly showing a reversal signal.)
In-Depth Analysis of the Evening Star Pattern
When observing the Evening Star pattern, many novice traders are attracted by its simplicity and ease of recognition. However, it’s worth noting that this pattern doesn’t always deliver the expected results. Research has shown that the accuracy of the Evening Star can vary depending on the timeframe and the market being traded.
1. Effectiveness of the Evening Star in the U.S. Stock Market
On major indices like the S&P 500, the Evening Star pattern tends to perform best during high-volatility market cycles. According to a study by Bulkowski in the book Encyclopedia of Chart Patterns, the Evening Star’s accuracy in predicting bearish reversals reaches around 72% when combined with declining trading volumes. However, this rate drops below 50% if the pattern forms in a sideways trend.
2. Is It Always Reliable?
Some experts argue that the Evening Star should not be used in isolation. In reality, there are numerous instances where this pattern merely reflects a temporary pause in the market before the uptrend resumes. For instance, in March 2020, when the U.S. stock market rebounded strongly after the COVID-19 sell-off, many Evening Star patterns appeared but did not lead to the expected reversals. Instead, prices continued rising due to significant inflows from economic stimulus packages.
3. Price Action Analysis Combined with Volume
One often-overlooked factor in analyzing the Evening Star is trading volume. If volume declines progressively through the pattern, the reversal signal may lack reliability. Conversely, when the third candlestick in the pattern shows a sharp increase in volume, it reinforces the likelihood that the bears have taken control of the market.
4. The Evening Star Pattern in Highly Volatile Markets
The Japanese stock market, known for its high volatility, provides a practical example of how to use the Evening Star effectively. During 2013–2015, when the Nikkei 225 index experienced frequent sharp fluctuations, the Evening Star often appeared, especially near major resistance levels. A notable instance occurred in June 2015, when this pattern formed around 20,600 points, signaling a subsequent drop of over 7% within two weeks.
Limitations of Applying the Evening Star in Trading
1. Unsuitable for Markets with Strong Trends
In a strong uptrend supported by solid fundamentals, the Evening Star is prone to generating false signals. For example, in the European stock market during 2021, despite multiple Evening Star patterns appearing on the DAX chart, the index rose by over 15% throughout the year.
2. Market Sentiment as a Decisive Factor
Technical analysis alone is not always sufficient. At times, psychological factors or unexpected events can disrupt all predictions. For instance, the Federal Reserve’s surprise interest rate hike announcement in December 2018 overshadowed all technical patterns, including the Evening Star, leading to a sharp market decline in a short period.
Effective Combination Strategies
1. Combine with Fibonacci Retracement
When the Evening Star appears near Fibonacci retracement levels like 61.8%, the likelihood of a reversal tends to be higher. This is a popular strategy employed by traders in global stock markets.
2. Use Momentum Indicators
Indicators like RSI or the Stochastic Oscillator can help confirm signals from the Evening Star. If the RSI is in overbought territory (>70) when the pattern forms, the bearish signal becomes more credible.
In the U.S. stock market, DLMvn has observed that combining the Evening Star with multiple time frame analysis yields better results. If this pattern appears on both daily and weekly charts, the likelihood of a reversal increases significantly.

DLMvn > Trading Indicators > Mastering the Market with the Evening Star Candlestick Pattern
Expand Your Knowledge in This Area
Trading Indicators
Price Action vs Indicators – Which One Suits Your Trading Style?
Trading Indicators
Triangle Patterns: The Most Common Patterns Appearing on Charts
Trading Indicators
Trade Smarter with the Double Top Chart Pattern
Trading Indicators
“Trend is Your Friend” – How to Identify a Strong Trend in the Stock Market
Trading Indicators
Piercing Line and How to Use It for Market Top/Bottom Reversal in Trading
Trading Indicators
Decoding Overbought and Oversold Phenomena: What Do They Mean?