In the stock market, continuation price patterns are important signals that help traders identify when the price trend is likely to continue in the same direction after the pattern is completed. These patterns not only help predict the market accurately but also provide effective trading opportunities. However, to fully leverage the power of these price patterns, a solid understanding and a well-structured trading approach are necessary.
What Are Continuation Price Patterns?
Continuation price patterns are chart formations that are easy to recognize when the market moves within a short range. After the pattern is completed, the price will continue in the original direction, creating an opportunity for traders to enter the market. These are powerful signals that you can rely on to make the right trading decisions.
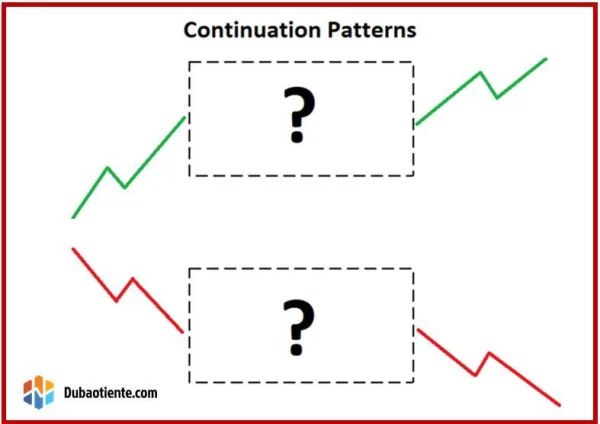
Bullish Continuation Patterns
1. Ascending Triangle
The ascending triangle is a fairly common pattern in the stock market, especially in an uptrend. This pattern forms when two trendlines converge: a horizontal resistance line on top and an upward sloping support line below. When the price breaks through the resistance level, it is a clear signal to enter the market.
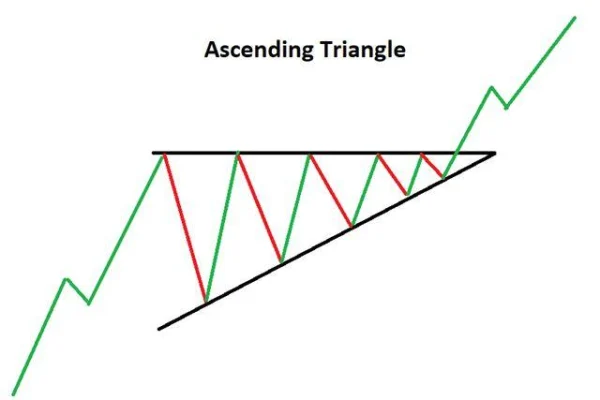
For example, during a strong uptrend in Apple stock at the beginning of 2021, the ascending triangle pattern appeared before the price continued to rise sharply. For investors, accurately identifying this pattern could lead to significant profits.
2. Bullish Pennant
The bullish pennant is a continuation pattern that appears after a strong market trend. After a sharp price increase, the market fluctuates within a narrow range before continuing in the original direction. This pattern typically appears when there is significant growth over a short period.
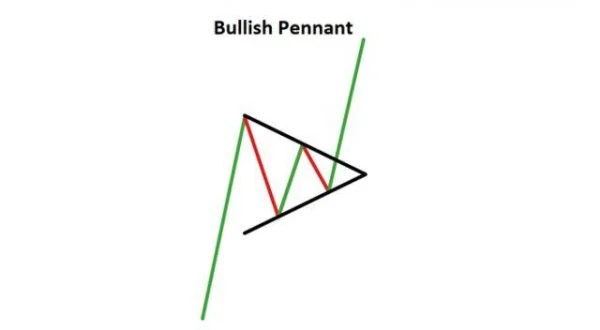
To trade effectively with this pattern, you need to identify the breakout point, where the price breaks above resistance, and then enter the trade to capitalize on the strong upward momentum. One advantage of the bullish pennant pattern is that it provides an attractive entry point when the price continues to move in the established direction.
3. Bullish Flag
The bullish flag pattern is one of the strongest patterns that professional traders cannot overlook. It appears after a strong uptrend, followed by a slight correction, forming a downward-sloping channel. This pattern is similar to the bullish pennant but may offer better entry points.

This pattern can develop within a short period (1 to 3 weeks), allowing traders to seize the opportunity quickly.
4. Bullish Rectangle Pattern
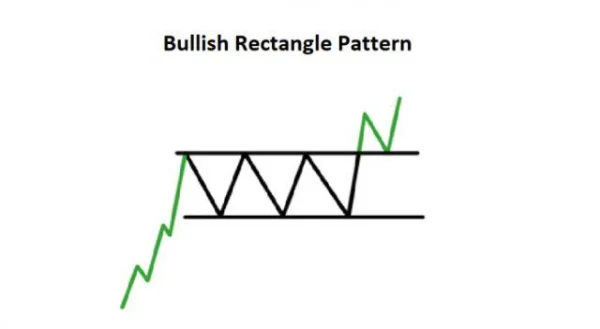
The bullish rectangle pattern typically appears when the price moves sideways between two support and resistance levels. This pattern indicates an accumulation phase, where the market pauses before continuing the strong uptrend. Traders can trade in two ways: either trading within the channel or trading the breakout when the price surpasses the support or resistance levels.
Bearish Continuation Patterns
Bearish continuation price patterns reflect the continuation of a downtrend after a significant price decline and a pause before further drops.
1. Descending Triangle
The descending triangle is the opposite of the ascending triangle. This pattern appears in a downtrend when there is a downward-sloping resistance line on top and a horizontal support line below. This pattern signals that the price may continue to fall after breaking below the support level.
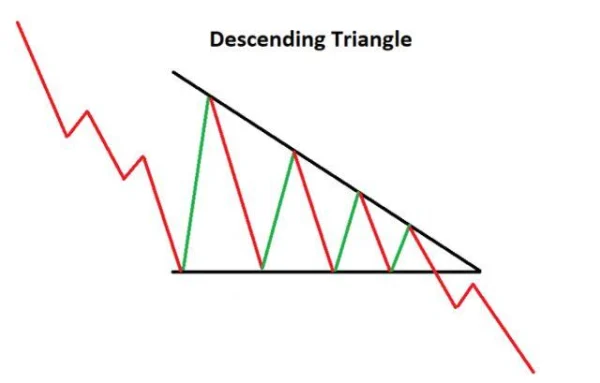
To trade with this pattern, traders need to wait for the breakout below the support level and enter the trade when the signal is clear.
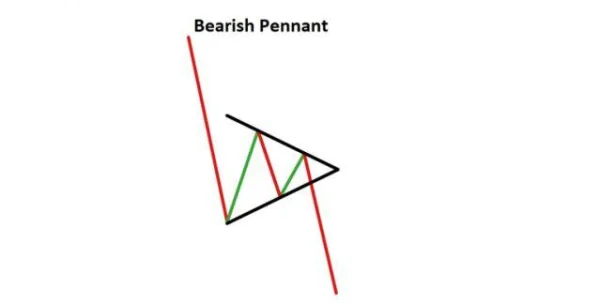
2. Bearish Pennant
Similar to the bullish pennant, the bearish pennant appears after a strong downward move and then fluctuates within a narrow range. This pattern signals the continuation of a downtrend, and traders can look for an entry point when the price breaks below the flagpole.
3. Bearish Flag
The bearish flag pattern is similar to the bullish flag but appears in a downtrend. It is characterized by an upward-sloping channel, opposite to the preceding downward trend. After the price consolidates within this channel, it will continue to decline sharply when it breaks below the support level.

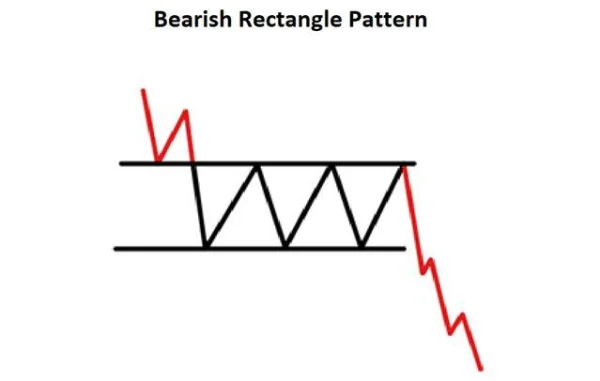
4. Bearish Rectangle
The bearish rectangle is a pattern that forms sideways between support and resistance levels in a downtrend. After this accumulation phase, the price may continue to fall sharply when it breaks below the support level.
Guide to Trading with Continuation Price Patterns
When trading with continuation price patterns, DLMvn always advises you to start by identifying the main trend of the market. Use trendlines to spot the forming continuation price patterns. Once you have identified the pattern, make sure to set appropriate stop points and limits in accordance with a favorable risk/reward ratio.
Don’t forget that waiting for a strong breakout before entering a trade is essential. Additionally, to avoid risks from false breakouts, you should set tight stop-loss levels and closely monitor the market as it moves in your favor.
Remember, applying a reasonable trading strategy, being patient, and always practicing good risk management will help you make the most of continuation price patterns to achieve sustainable profits in the stock market.
In-Depth Analysis of Continuation Patterns
Continuation price patterns are patterns that reflect a pause in the current trend. After completion, the price will continue to move in the same direction as the original trend. While these patterns are very powerful, they are not always 100% accurate. That’s why identifying a continuation pattern correctly is not enough. You need to know how to combine them with other tools and strategies to achieve optimal results.
1. Bullish Continuation Patterns: When the Uptrend Is Strong
Continuation price patterns such as the Ascending Triangle or Bullish Pennant show market accumulation before continuing the upward momentum. However, identifying these patterns is not always easy, especially when the price moves in a narrow range, which can lead to confusion.
A famous study by J.P. Morgan revealed that continuation price patterns can have an accuracy rate of up to 70% when applied correctly. However, experts advise not to rely solely on price patterns. In reality, market signals can be skewed, especially when influenced by macroeconomic factors such as monetary policy or company financial reports.
In 2020, Tesla’s stock formed an Ascending Triangle pattern for an extended period before breaking the resistance level and soaring to a record high. However, this breakout was not always certain, as factors like global market volatility raised concerns. This shows that while continuation price patterns are essential, combining them with other indicators like the RSI (Relative Strength Index) or MACD can help improve reliability.
2. Bearish Continuation Patterns: A Cautionary Strategy
When the market declines, continuation price patterns such as the Descending Triangle or Bearish Pennant are important signals that the price will continue to drop. However, you need to be especially cautious of “false breakouts” — when the price exits the pattern artificially but does not follow the predicted trend. This is one of the biggest challenges that traders face when using bearish continuation patterns.
A prime example in international stock markets is Netflix’s stock in mid-2018. The Descending Triangle pattern formed over time, but then the price suddenly rebounded instead of continuing the downtrend. This not only shows the need to check for additional signals but also warns that not all continuation patterns are absolutely reliable.
3. The Importance of Risk Management
Any price pattern can be a “double-edged sword” without a proper risk management strategy. DLMvn emphasizes that no pattern guarantees a 100% win rate. Therefore, you need to set stop-loss levels tightly, while paying attention to the risk/reward ratio to ensure that even if you experience a loss in one trade, you can still maintain long-term profitability.
A study by CME Group showed that traders who use continuation price patterns combined with reasonable stop-loss levels can minimize losses and increase their win rate by up to 45%.
4. A Contrarian View on Continuation Price Patterns
Although continuation price patterns are often considered powerful tools, there is a contrary view that they do not always reflect reality. Contrary to the popular belief that these patterns always lead to the old trend, some analysts argue that continuation price patterns may merely be random occurrences and not always accurately predict the trend.
For example, in some cases, especially during periods of market instability, continuation price patterns may not accurately reflect market developments. A classic example is the massive volatility in the U.S. stock market in March 2020, when the COVID-19 pandemic caused global market chaos. In this context, many continuation patterns appeared but did not follow the predicted trends.
DLMvn suggests that over-relying on price patterns without combining them with fundamental factors and macroeconomic analysis can lead to poor investment decisions. Instead, you should combine technical analysis with fundamental analysis and other market indicators to gain a more comprehensive view.

DLMvn > Trading Indicators > Key Continuation Price Patterns Every Investor Should Know
Expand Your Knowledge in This Area
Trading Indicators
Pivot Points: How to Identify Support and Resistance Levels
Trading Indicators
Increase Your Trading Opportunities with Bullish Hammer Candlestick
Trading Indicators
5 Variations of the Doji Star Candlestick Pattern
Trading Indicators
Harami Candlestick Pattern and How to Trade It for Maximum Profit
Trading Indicators
Evaluating the Dark Cloud Cover Candlestick Pattern: Opportunity or Trap for Investors?
Trading Indicators
Essential Knowledge For Trading With Price Channels