TABLE OF CONTENTS
- What is a Bullish Hammer Candlestick?
- Characteristics of a Bullish Hammer Candlestick
- Using a Bullish Hammer Candlestick in Trading
- Using a Bullish Hammer in the Stock Market
- Risk Management and Maximizing Opportunities
- A Deeper Look at the Bullish Hammer Candlestick
- Considering the Relationship Between Trading Volume and the Bullish Hammer Candlestick
- Contrary Viewpoint: Should the Bullish Hammer Always Be Trusted?
- Specific Example in the Global Stock Market
- Advice for Traders
What is a Bullish Hammer Candlestick?
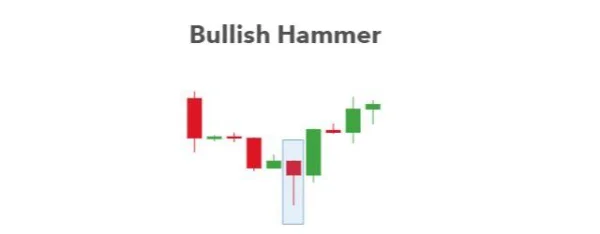
A Bullish Hammer is a single candlestick pattern that signals the potential reversal from a downtrend to an uptrend. It occurs when the price of an asset drops to a new low in a downtrend, but then recovers strongly and closes near the opening price. This indicates rejection of lower prices and increasing buying pressure. An important feature is that the lower shadow of the candlestick must be at least twice the length of the body.

Many beginner traders might easily confuse a Bullish Hammer with a Bearish Hanging Man, as both look similar. However, the key difference between them lies in their positions within a trend. While the Hanging Man appears at the end of an uptrend and signals a potential bearish reversal, the Bullish Hammer appears at the bottom of a downtrend and signals a potential bullish reversal.
Characteristics of a Bullish Hammer Candlestick
A Bullish Hammer candlestick has key features that you should pay attention to:
- The body of the candlestick is short, and the lower shadow is long, at least twice the length of the body.
- It appears at the bottom of a downtrend.
- It is often used in conjunction with other technical indicators to confirm the signal.
The importance of the Bullish Hammer lies in its ability to predict a potential reversal. When it appears, it indicates that the market is beginning to shift from a strong downtrend to an uptrend, and this could be an opportunity to open a long position.
Using a Bullish Hammer Candlestick in Trading
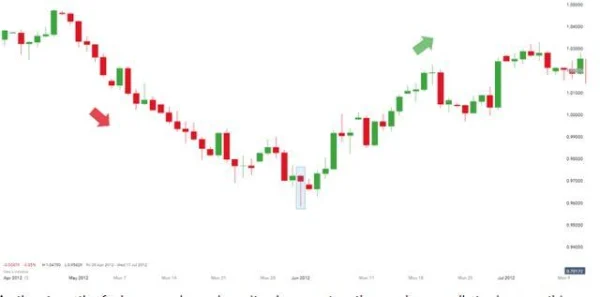
The Bullish Hammer is easy to identify on charts and can be found across various time frames. A typical example is the AUD/USD currency pair, where from April 20 to May 31, the price dropped 892 pips. However, after a Bullish Hammer appeared, the price reversed and increased by 792 pips.

It is important to pay attention to the position of the Bullish Hammer on the chart. When this candlestick appears at strong support levels or near Fibonacci retracement zones, its signal becomes even stronger. You can use indicators like Pivot Points to further confirm this reversal trend. In an ideal scenario, the lower shadow will break through the support level, but the price will close above the support, creating a clear buy signal.
Using a Bullish Hammer in the Stock Market
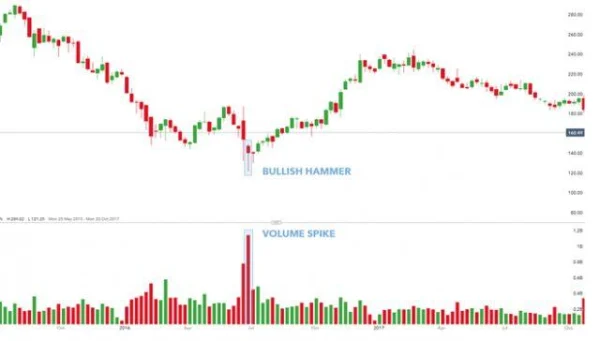
In the stock market, confirming the signal with trading volume is essential. When you see a Bullish Hammer accompanied by an increase in trading volume, this is a strong signal indicating investor participation and the potential for a bullish reversal.

Take the example of Barclays PLC stock. A Bullish Hammer appeared, and at the same time, trading volume surged. This signaled that the market was starting to show strong bullish momentum, and traders could join this uptrend. However, DLMvn emphasizes that risk management is a crucial element in every trade. Traders need to ensure that stop-loss points are set at reasonable levels to protect their accounts from unforeseen fluctuations.
Risk Management and Maximizing Opportunities
However, using a Bullish Hammer is not without risk. One of the biggest mistakes many traders make is rushing into a trade without confirming the reversal signal with other technical analysis tools. A Bullish Hammer can create a strong signal, but it is only truly effective when combined with other indicators such as RSI, MACD, or Fibonacci.
Before entering a trade, always check trading volume and confirmatory indicators for the trend. A Bullish Hammer with low trading volume may not be the strong signal you need.
In practice, trading with a Bullish Hammer requires patience and a clear risk management strategy. Do not just look at a single candlestick while overlooking other important factors such as its position in the trend, support or resistance levels, and additional technical indicators.
A Deeper Look at the Bullish Hammer Candlestick
DLMvn understands that the Bullish Hammer is often seen as a strong reversal signal in technical analysis, but is it always accurate? In the world of stock trading, one of the biggest challenges investors face is the reliability of technical signals. While the Bullish Hammer can offer great opportunities, if you fail to consider the surrounding factors, you may fall into the trap of “over-trusting” the reversal signal.
A major issue when using the Bullish Hammer is the reliability of the signal. In some cases, especially in markets heavily influenced by fundamental factors, a Bullish Hammer may not be reliable. For example, in the U.S. stock market, a Bullish Hammer appearing on the chart of a stock with weak financial fundamentals might indicate a temporary bounce, not a strong reversal. This is why combining fundamental factors (like financial reports, industry outlook, and macroeconomic news) with technical analysis is extremely important.
Considering the Relationship Between Trading Volume and the Bullish Hammer Candlestick
Another factor to consider is the relationship between trading volume and the Bullish Hammer candlestick. This candlestick becomes much stronger when supported by high trading volume. In practice, one of the ways to assess the reliability of a Bullish Hammer signal is to examine the accompanying trading volume. In developed markets such as the U.S. stock market, high trading volume often aligns with confirmation from large investors. If a Bullish Hammer appears without a significant increase in trading volume, you might need to be more cautious before entering a trade.
We can look at a prominent example from the U.S. stock market. At the end of 2018, shares of Apple (AAPL) displayed several Bullish Hammer candlesticks; however, trading volume did not increase significantly. In this case, although the Bullish Hammer was a signal of a potential bullish reversal, the low trading volume made the signal less reliable. Experienced traders would look at this and decide not to take long positions because there was no strong confirmation from the market.
Contrary Viewpoint: Should the Bullish Hammer Always Be Trusted?
Some technical analysts hold a contrary view about using the Bullish Hammer as a strong reversal signal. They argue that in a strong trending market, a Bullish Hammer may only represent a temporary bounce rather than a definite sign of a new trend. Specifically, in global stock markets, macroeconomic events such as the U.S. Federal Reserve’s monetary policy or corporate earnings reports can create volatility that outweighs any technical signal.
Therefore, many experienced traders do not rely solely on a Bullish Hammer to make trading decisions. Instead, they often look for confirmation from indicators such as the Relative Strength Index (RSI), Moving Average Convergence Divergence (MACD), or Fibonacci levels to be more certain of the trend reversal.
Specific Example in the Global Stock Market
One of the most notable examples of using a Bullish Hammer in trading is Tesla’s (TSLA) stock in 2020. After a sharp decline due to the impact of the COVID-19 pandemic, TSLA shares fell from over $900 to $350 in less than two months. However, a Bullish Hammer appeared in April 2020, signaling a strong recovery.
When combined with high trading volume and the growth of the technology sector, the Bullish Hammer at that time became a reliable signal. Indeed, after the Bullish Hammer appeared, TSLA shares recovered and surged to over $2,000 by the end of 2020. This proves that in a favorable market environment, the Bullish Hammer can be a very powerful signal.
Advice for Traders
One important piece of advice that DLMvn wants to share is not to rely solely on a single candlestick when making trading decisions. While the Bullish Hammer can be a strong signal, combining it with other technical indicators, such as trading volume or momentum indicators, can enhance the accuracy of trading decisions. Remember that in every trade, risk management is essential. Never let a Bullish Hammer candlestick lure you into a trade without confirmation from other factors.
Always use the Bullish Hammer as part of an overall trading strategy and avoid becoming overly reliant on any single signal.

DLMvn > Trading Indicators > Increase Your Trading Opportunities with Bullish Hammer Candlestick
Tagged Articles
How to Identify and Trade Hammer Candlesticks on Charts
Expand Your Knowledge in This Area
Trading Indicators
What is the Shooting Star Candlestick Pattern? Meaning and How to Identify It
Trading Indicators
Simple Trading Strategy with Support and Resistance
Trading Indicators
Mastering the Morning Star Candlestick to Conquer the Market
Trading Indicators
“Trend is Your Friend” – How to Identify a Strong Trend in the Stock Market
Trading Indicators
Clearly Identifying the Flag Pattern in Trading
Trading Indicators
Streamlining Strategies: Mastering RSI to Maximize Profits