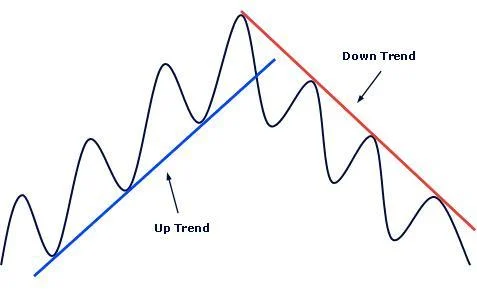
Trendlines are a fundamental and crucial tool in any trading system, helping investors assess market trends and identify support and resistance levels. As the saying goes, “Trend is your friend,” recognizing the trend is the first but also an extremely important step on the path to successful trading.

Trendline
A trendline is not just a line on the chart; it is a powerful indicator that helps you, DLMvn, determine the market’s direction. This allows you to capture the price movement’s rhythm and make informed trading decisions. But what makes a trendline accurate and reliable?
1. Identifying a Trendline
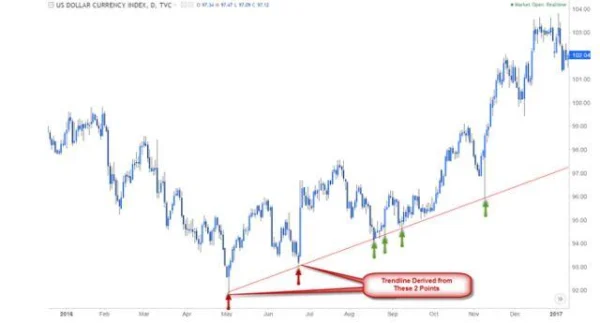
To draw an accurate trendline, you need at least two price points on the chart. However, the more important factor is the number of touchpoints between the trendline and the price – the more touchpoints, the more reliable the trendline is. A strong trendline will extend over a long period, reflecting the overall market trend.

For example, in the U.S. stock market, with the S&P 500 index, one of the most important indexes, when the index continuously breaks through higher highs and lows on an upward trendline, it confirms the uptrend and helps traders make the right trading decisions.
2. The Role of the Trendline
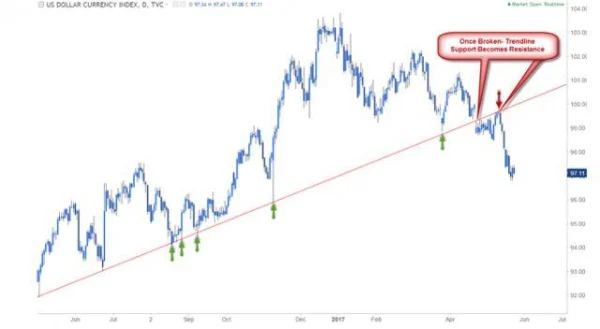
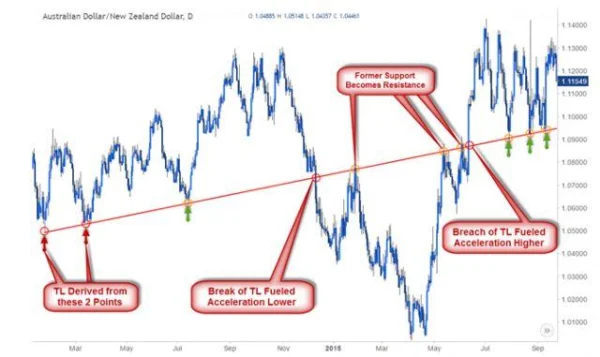
The role of a trendline can change depending on the market’s volatility. When the price breaks the trendline, it may switch from support to resistance, and vice versa. One of the clearest signals is when the price breaks the trendline and immediately acts as a new resistance or support level.

A real-world example in the U.S. stock market with Amazon (AMZN), when its stock price broke the support trendline during a market downturn, it immediately triggered a strong sell-off. Conversely, when the price bounced off the resistance trendline, it maintained a strong uptrend, confirming the role of the trendline in traders’ strategies.

3. Important Considerations When Using Trendlines
DLMvn, there are several important points to note when using trendlines for trading:
-
Third touchpoint: Any two highs or lows that connect can form a trendline. However, for the trendline to be truly reliable, you need at least three touchpoints. This helps confirm that the trend is continuing and is not just a market random occurrence.
-
Confirmation with a larger time frame: One common mistake many traders make is trading immediately when the price breaks the trendline. DLMvn should trade with the assumption that the trendline will hold, but if there is a breakout, you need to confirm whether the price really breaks through. Especially for day trading, you should wait until the price closes on the Daily time frame to ensure the breakout is valid.
-
Be cautious of false breakouts: Not every trendline breakout comes with a strong move. Sometimes, the market may “trick” you with a false breakout, where the price continues to move against the trend after breaking the trendline. This often happens in periods of market indecision or during short-term corrections.
Instead of rushing to trade immediately when the market breaks a trendline, wait for the price to return and retest the support or resistance level before entering. This helps you avoid false breakouts and protects your trading account.
- Retest technique: After the price breaks a trendline, you should wait for a retest to confirm the new support or resistance level. This technique helps you trade with lower risk because when the price returns and holds the support or resistance level, you will have a stronger basis to enter the trade.
Challenges When Trading with Trendlines
DLMvn, one of the biggest challenges when using trendlines is the ability to identify and draw them accurately in an unstable market environment. As financial markets evolve, factors affecting prices become more diverse and complex, making it difficult to draw an “accurate” trendline. Even a slight change in price behavior or market-impacting news can render a trendline you’ve just drawn meaningless.
For example, when Apple (AAPL) in 2020, amid the COVID-19 pandemic, experienced a strong correction despite having maintained a consistent uptrend prior, this clearly showed that a trendline based on historical data might not remain accurate when external factors such as global volatility or company policy changes come into play. In such cases, relying too much on the trendline without factoring in other elements like news, earnings reports, or other indicators could lead to trading errors.
Another issue is the “pragmatism” in applying trendlines. Many traders, especially beginners, often make the mistake of stubbornly sticking to a trendline without re-evaluating it when market signals indicate a change. Therefore, it’s crucial to maintain a flexible attitude and not base your trades on a single factor. DLMvn can apply other indicators such as Moving Average or RSI to verify the strength of the trend. This will help reduce the risk of sudden market reversals.
The Importance of Timeframe Evaluation
An important factor that many traders overlook when using trendlines is the timeframe they are trading in. Trendlines can look different when viewed on short-term, medium-term, or long-term timeframes. A trendline confirmed on a weekly chart can be completely different from one drawn on a daily or even hourly chart. In such cases, it’s essential to understand that long-term trends may not align with short-term fluctuations.
For example, when analyzing Microsoft (MSFT) stock, you may see a short-term upward trendline on the daily chart, but when switching to a weekly chart, the trendline might be facing a strong resistance level. This shows that focusing solely on a short-term timeframe may cause you to miss important signals that the market is providing.
Experts recommend combining trendlines across different timeframes to gain a more comprehensive view of the market. This approach helps you identify not only short-term trends but also long-term trends, allowing you to build a trading strategy that is more aligned with the overall market direction and less risky.
Contrasting Viewpoints on Trendlines
There is a contrasting viewpoint on using trendlines, with some arguing that focusing too much on drawing and monitoring trendlines may limit a trader’s flexibility. They argue that instead of solely relying on trendlines and trading based on what they show, traders should also consider other factors like market volatility, investor sentiment, and momentum indicators. This viewpoint is valid, as when markets become too tight, relying on trendlines may no longer be effective. In such times, external factors like macroeconomic events, monetary policy changes, or industry-specific news may have a stronger impact on prices.
A prime example is the 2008 financial crisis, where, despite technical indicators, including trendlines, clearly signaling a breakout, the market still experienced a severe decline due to external factors like the global debt crisis. This serves as a clear reminder that when external factors are not taken into account, trendlines can become misleading indicators.
However, many traders and investors continue to use trendlines as a primary tool in their trading strategies. This is not wrong, as long as you always remember that in a rapidly changing market, with nothing guaranteed, combining different methods such as momentum indicators, stock market signals, or a company’s fundamentals will enhance your chances of success in trading.
Using Trendlines Alongside Other Methods
DLMvn, as emphasized, for trendlines to truly be effective, you cannot rely on them in isolation. The global stock market is constantly changing and volatile, so you need to remain flexible and combine trendlines with other technical analysis tools. When you combine trendlines with indicators like MACD or RSI, you will be able to spot strong buy and sell signals, increasing your win rate and reducing risk in trading.
For example, in the case of Nvidia (NVDA) in 2023, using a trendline alongside the RSI indicator helped investors realize that the stock had become overbought after a strong price rally. Applying a multi-faceted analysis not only helps avoid sharp declines but also optimizes profits by seizing good opportunities from technical signals combined with fundamental factors.
So, whether you are a professional trader or just starting, using trendlines alongside other indicators will help you avoid serious trading mistakes. Always remember that in finance, nothing is certain, and every tool has its limits.

DLMvn > Trading Indicators > How to Identify Trendlines in Trading
Expand Your Knowledge in This Area
Trading Indicators
Evaluating the Dark Cloud Cover Candlestick Pattern: Opportunity or Trap for Investors?
Trading Indicators
What Are Lagging Indicators? A Comprehensive Guide And Practical Applications
Trading Indicators
10 Candlestick Patterns Every Trader Should Know
Trading Indicators
Hanging Man: A Reversal Candlestick Pattern
Trading Indicators
Profiting from the Morning Doji Star Candlestick Pattern
Trading Indicators
Mastering the Market with the Evening Star Candlestick Pattern