TABLE OF CONTENTS
- What is a Hammer Candlestick?
- Advantages and Disadvantages of the Hammer Candlestick
- How to Use Hammer Candlesticks in Technical Analysis
- The Importance of Market Context
- The Relationship Between Hammer Candlesticks and Technical Indicators
- Contrary Viewpoint: Is the Hammer Candlestick Really as Powerful as Often Claimed?
- Real-World Example from Global Stock Markets: Hammer Candlestick Trading in the S&P 500 and Dow Jones
- Personal Perspective on Trading with Hammer Candlesticks
- Combining Hammer Candlesticks with Risk Management Strategies
What is a Hammer Candlestick?
A hammer candlestick, also known as a Hammer, is a popular candlestick pattern in technical analysis, and it often appears when there is a trend reversal. DLMvn wants to share some important knowledge about this candlestick pattern to help you better understand how to identify and trade the hammer candlestick on charts.
1. Bullish Hammer
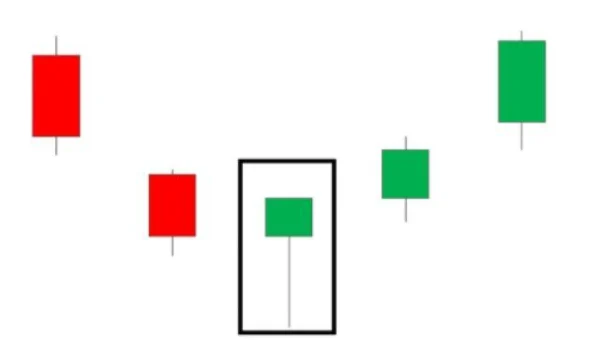
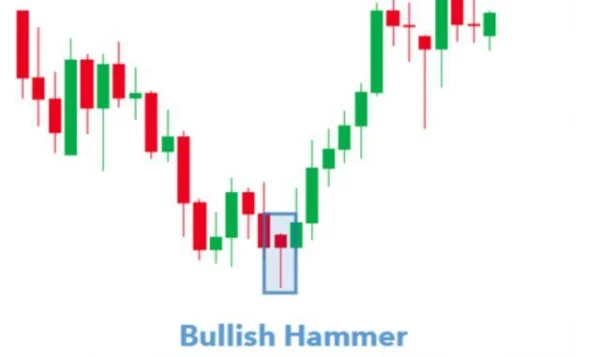
A bullish hammer is a strong signal indicating a reversal from a downtrend to an uptrend, appearing at the bottom of a downtrend. The structure of a bullish hammer consists of a small body, little or no upper wick, and a long lower wick. This shows that the market dropped to its lowest point, but then buying pressure emerged, pushing the price higher, demonstrating rejection of lower prices.

It is worth noting that although this hammer pattern signals a potential uptrend reversal, it can still be influenced by other market factors. Identifying the hammer candlestick at the right time and in the right context is crucial for making an informed decision.
2. Inverted Hammer
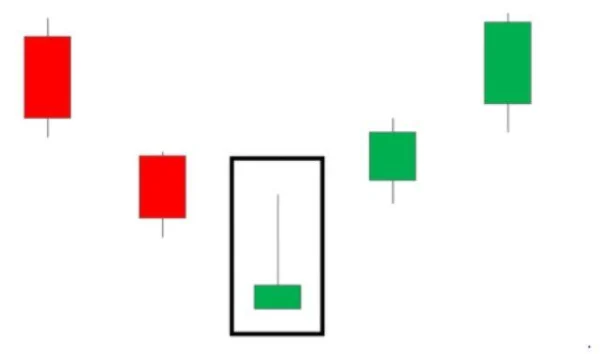
An inverted hammer also represents a reversal signal, but it has a different structure from a bullish hammer. This candlestick pattern appears at the bottom of a downtrend and features a long upper wick, with a small body and little or no lower wick. The inverted hammer signals that buyers (bulls) are gaining strength, pushing the price upward after a strong downtrend.

However, it’s important to note that the inverted hammer is not always accurate. When an inverted hammer appears, traders need to confirm the reversal signal with other tools, such as technical indicators or support/resistance levels.
Advantages and Disadvantages of the Hammer Candlestick
Nothing is perfect in trading. While the hammer candlestick can provide strong signals, it also has limitations that need to be considered. DLMvn will share the advantages and disadvantages that you should understand before applying them in your trades.
Advantages
- Reversal Signal: The hammer candlestick is a clear signal of rejection of lower prices, indicating the end of a downtrend and the potential for an uptrend reversal. This is a good opportunity for traders looking to enter a new trend.
- Exit Signal: For traders holding short positions, detecting a hammer candlestick can be a signal to close the trade and avoid being trapped in a reversing trend.
Disadvantages
- Relying on Hammer Candlestick Alone: If you only look at the hammer pattern without considering the overall trend context, traders may make incorrect decisions. Ignoring supporting factors such as Fibonacci levels or technical indicators can reduce the accuracy of the signal.
- Need for Supporting Tools: To trade with the hammer candlestick accurately, you need to combine it with other technical indicators like RSI or CCI to confirm overbought/oversold conditions or key support/resistance levels.
How to Use Hammer Candlesticks in Technical Analysis
Example of Trading a Hammer Candlestick on the Weekly Chart
To apply the hammer candlestick in real trading, DLMvn shares a typical example on the weekly chart of the EUR/USD pair. On the chart, you can see that the price has dropped significantly, forming a bullish hammer at the bottom of the downtrend. This is a signal indicating that selling pressure has decreased, and a trend reversal may occur.

Once the hammer candlestick is identified, traders can enter a buy position when the price closes above the hammer. Meanwhile, stop-loss points can be placed below the nearby support zone, and the profit target can be based on recent resistance levels. It is important to maintain a proper risk/reward ratio.

Before entering a trade, you should observe the overall market trend and signals from other technical indicators. Do not rush into a trade without full confirmation from surrounding factors.
The Importance of Market Context
DLMvn wants you to understand that a hammer candlestick does not always provide an accurate reversal signal. One of the biggest mistakes many traders make when trading with hammer candlesticks is relying solely on this candlestick pattern without considering the surrounding market context. Understanding the broader market context is crucial.
For example, if a hammer candlestick appears in a strong market with a long-term downtrend, the reversal signal might only be temporary, potentially just a pullback in a strong downtrend. In this case, traders need to exercise caution when entering a trade and use additional indicators to confirm the signal.
The Relationship Between Hammer Candlesticks and Technical Indicators
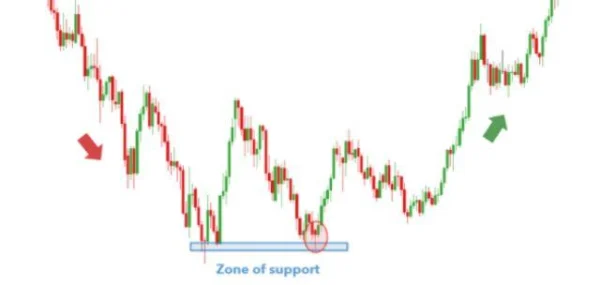
An important factor when trading with hammer candlesticks is combining them with other technical indicators to enhance the accuracy of the signal. For instance, when a hammer candlestick appears at a significant support level or near Fibonacci levels, the likelihood of a reversal signal increases significantly. You can also use indicators like RSI (Relative Strength Index) or CCI (Commodity Channel Index) to check if the market is in an oversold condition, which will increase the probability that the hammer candlestick truly signals a reversal.
A study of the U.S. stock market found that when a hammer candlestick appears near support levels and is confirmed by indicators like RSI or MACD, the success rate of this signal can reach 70% in the short term. However, if the hammer candlestick is used alone without confirmation from other tools, the success rate drops significantly.
Contrary Viewpoint: Is the Hammer Candlestick Really as Powerful as Often Claimed?
However, there are opposing views about the strength of the hammer candlestick. Some experts, especially those with extensive experience in the stock market, argue that the hammer candlestick is not always an accurate reversal signal. One major issue is that these signals can create “traps” when they appear in markets without a clear trend.
For example, in the U.S. stock market in 2019, the S&P 500 index produced a series of hammer candlesticks during unclear market phases. However, instead of signaling a reversal, many of these signals led to the continuation of the previous trend. At that time, the hammer candlesticks could easily have been misunderstood as strong buy signals, but in reality, the market continued its prolonged downtrend. This shows that when trading, you cannot rely solely on a single candlestick pattern; you must also consider the overall trend and confirmatory signals from other tools.
Real-World Example from Global Stock Markets: Hammer Candlestick Trading in the S&P 500 and Dow Jones
A typical example in the U.S. stock market is the use of hammer candlesticks in trading the S&P 500 and Dow Jones indices. At the end of 2018, when the U.S. stock market underwent a significant correction, hammer candlesticks appeared at the bottom of the downtrend on both indices. Traders used this signal to enter short-term buy trades.
However, an important point to note is that not every hammer candlestick signals the end of a downtrend. A true reversal only occurs when confirmed by factors like trendlines, support levels, or consensus from other technical indicators. In this case, many traders used indicators like RSI and MACD to confirm whether the trend could truly reverse.
Personal Perspective on Trading with Hammer Candlesticks
In DLMvn’s experience, when trading with hammer candlesticks, it is important to be patient and not rush into a trade. The hammer candlestick is merely a signal indicating rejection of lower prices, but to ensure a high success rate, you need confirmation from multiple factors. Remember, a skilled trader is not someone who enters a trade the moment a hammer candlestick appears but someone who knows how to read the right signals and confirm the market context.
One technique that DLMvn often applies is waiting for the market to confirm the reversal through subsequent candlestick patterns or using technical indicators to seek confirmation. This helps minimize risk and increase the success rate in trades.
Combining Hammer Candlesticks with Risk Management Strategies
When applying hammer candlesticks in trading, risk management plays an extremely important role. You cannot rely on a single signal without an appropriate risk management strategy. DLMvn encourages you to use reasonable stop-loss levels when trading with hammer candlesticks. This will help protect your account if the signal turns out to be inaccurate and avoid significant losses.
Additionally, applying a reasonable risk/reward ratio in each trade will help you optimize profits and minimize risks. Make sure that you never accept a trade with a risk/reward ratio lower than 1:2.

DLMvn > Trading Indicators > How to Identify and Trade Hammer Candlesticks on Charts
Tagged Articles
Increase Your Trading Opportunities with Bullish Hammer Candlestick
Expand Your Knowledge in This Area
Trading Indicators
Discover How to Trade Using the Wedge Pattern
Trading Indicators
Essential Technical Indicators Every Trader Should Master
Trading Indicators
How to Identify Trendlines in Trading
GlossaryTrading Indicators
Stochastic Oscillator: An Effective Tool For Forecasting Market Trends
Trading Indicators
Discover How to Combine Moving Averages with Candlestick Patterns Effectively
Trading Indicators
4 Ways to Leverage Support and Resistance for Optimal Trading