TABLE OF CONTENTS
- What is the Head and Shoulders Pattern?
- The Inverse Head and Shoulders Pattern
- How to Identify the Head and Shoulders Pattern
- Trading with the Head and Shoulders Pattern
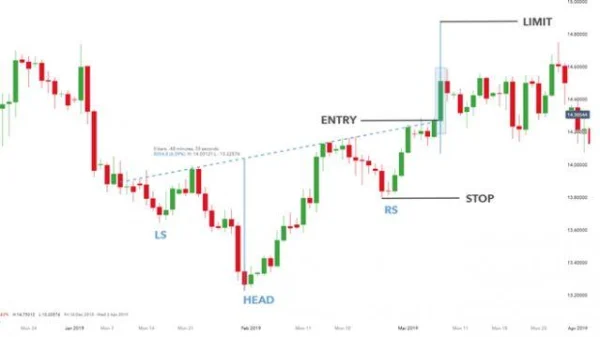
- Trading with the Inverse Head and Shoulders
- Advantages and Disadvantages of the Head and Shoulders Pattern
- Factors Affecting the Head and Shoulders Pattern
- Accuracy and Success Rate of the Pattern
- Head and Shoulders Pattern in the Global Stock Market
- Contrarian View: The Head and Shoulders Pattern Can Lead to Profit, But the Risk Is High
The Head and Shoulders (H&S) pattern has long been considered one of the most popular chart patterns in technical analysis. With its high accuracy in predicting market reversals, this pattern is an essential tool for professional traders. However, identifying this pattern is not always straightforward, and many traders struggle when faced with unclear signals.
What is the Head and Shoulders Pattern?
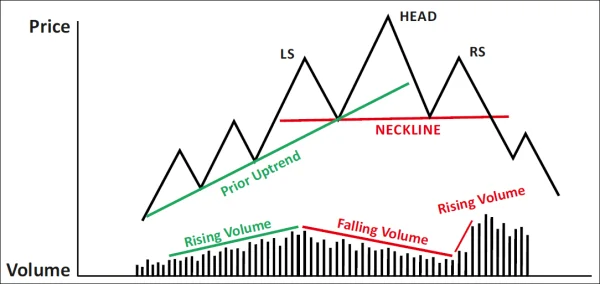
The Head and Shoulders pattern is a distinct formation used to identify potential reversal signals. True to its name, this pattern consists of three parts: the “left shoulder,” the “head,” the “right shoulder,” and the “neckline.” When a market is in an uptrend, the appearance of the Head and Shoulders pattern signals a potential bearish reversal.
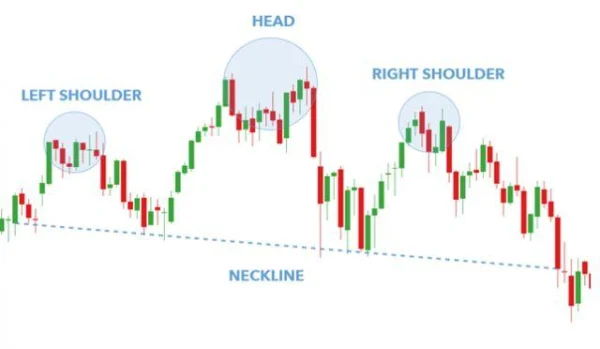
This pattern forms in three distinct phases. First, the price creates a high (the head), then drops to form a lower peak (the left shoulder), and subsequently rises again to form a second high (the right shoulder), which is lower than the first head. When the price falls below the neckline, this confirms that the pattern is complete and suggests a potential reversal.
The Inverse Head and Shoulders Pattern
In contrast to the Head and Shoulders pattern, the Inverse Head and Shoulders pattern appears during a downtrend and signals a potential bullish reversal. Although the structure of this pattern is similar to the Head and Shoulders, it occurs at the bottom of a downtrend and can indicate a price recovery.
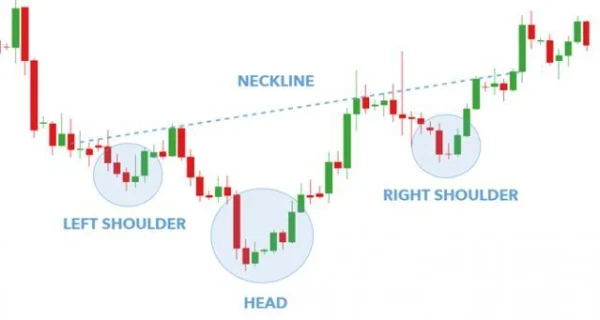
Signals from the Inverse Head and Shoulders pattern can help traders look for buying opportunities, as the formation of this pattern indicates strengthening buying pressure, ready to push the price higher.
How to Identify the Head and Shoulders Pattern
To accurately identify the Head and Shoulders pattern, you need to use several technical tools. The first important step is to determine the market trend using Price Action and technical indicators. Next, pay attention to the structure of the pattern, particularly the distance between its parts. The closer the parts are to each other, the clearer the pattern, and the higher the likelihood of an accurate prediction.
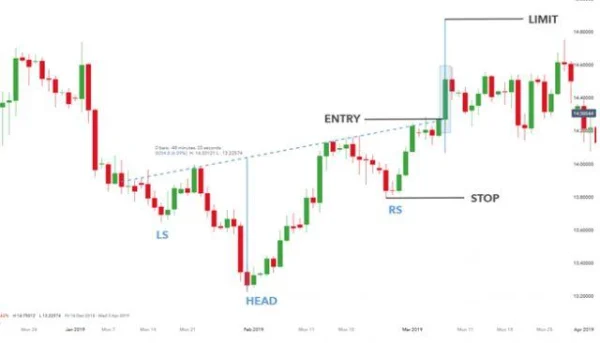
Next, identify the neckline, which is the key price level that confirms the reversal. When the price breaks below the neckline, this is a strong entry signal.
Trading with the Head and Shoulders Pattern
For a practical example from the German stock market, the DAX 30 index clearly formed a Head and Shoulders pattern. The neckline is highlighted by a green horizontal line. Traders would open a short position when the price closes below the neckline, as this serves as a strong signal of a market reversal.
However, trading immediately after the price breaks below the neckline can yield high profits, but this strategy also carries high risk if confirmation from the candlestick closing below the neckline is not received. To reduce risk, you can wait for the candlestick to close below the neckline before entering the trade.
In this case, the stop loss would be placed at the right shoulder of the pattern, while the distance between the head and the neckline would be calculated to set the profit target. For example, in the case of the DAX 30, the limit could reach 1832.8 pips. The risk/reward ratio here is approximately 1:1.2.
Trading with the Inverse Head and Shoulders
When the Inverse Head and Shoulders pattern appears, you must also pay attention to the basic elements of the pattern. Sometimes, you may find that the structure is not perfectly symmetrical, but the pattern can still provide a strong signal. The neckline of this pattern may not be completely horizontal, but it still maintains the characteristics of the pattern and can help you open a buy position.
When the price breaks above the neckline in an upward direction, you will have an opportunity to enter a buy trade. However, just like with the Head and Shoulders pattern, you need to confirm the signal through the candlestick close to minimize risk.
Advantages and Disadvantages of the Head and Shoulders Pattern
Advantages:
The Head and Shoulders pattern is very easy to recognize and use, especially for experienced traders. For seasoned investors, it is a powerful tool to identify potential trading opportunities, optimizing profit potential.
Profit-taking and stop-loss levels are easily determined based on the position of the neckline. This helps manage trades more effectively and understand at which price point a reversal may occur.
Disadvantages:
For novice traders, identifying the Head and Shoulders pattern is not easy. They may have difficulty distinguishing between different price patterns, leading to incorrect decisions.
Another factor to consider is confirming signals with a candlestick close below the neckline. Sometimes, confirmation candles may close too far below the neckline, leading to a large stop-loss distance, which requires careful consideration before deciding to enter the trade.
Additionally, the price may retest the neckline, causing confusion for newer traders, making it more difficult to identify reversal signals.
Factors Affecting the Head and Shoulders Pattern
Although this pattern can provide strong reversal signals, it is also easily influenced by factors beyond your control, such as market psychology, news, and unexpected events. One of the clearest examples is when Head and Shoulders patterns can be “broken” due to unexpected news, such as monetary policy decisions by the U.S. Federal Reserve or major political events.
Example: In 2018, the S&P 500 index formed a very clear Head and Shoulders pattern. However, in December of that year, the global stock market was strongly affected by speculation about the U.S.-China trade war. This led to a breakdown of the neckline of the Head and Shoulders pattern, causing many traders to sell at the wrong time, resulting in significant losses.
In this case, although the Head and Shoulders pattern appeared “perfect” technically, external factors made it inaccurate. Therefore, you need to understand that this pattern is not an absolute signal and can change due to market influences.
Accuracy and Success Rate of the Pattern
A common question among traders is whether the Head and Shoulders pattern really has as high a win rate as people claim. The answer is yes, but with an important condition: you must fully understand the confirming factors and the relationship between the parts of the pattern.
According to a famous study by Market Wizards on the effectiveness of reversal patterns, the accuracy rate of the Head and Shoulders pattern in predicting trend reversals is around 70-80% when the signals are properly confirmed. However, if you only look at the shape of the pattern without paying attention to candlestick confirmation and additional technical indicators, the success rate drops significantly. Data from these studies show that combining patterns like Head and Shoulders with tools like the RSI (Relative Strength Index) and MACD (Moving Average Convergence Divergence) can greatly increase accuracy.
Head and Shoulders Pattern in the Global Stock Market
One of the interesting features of the Head and Shoulders pattern is that it can be applied to all types of financial markets, including stocks, commodities, and indices. In the global stock market, this pattern is widely used to predict reversals in major indices. A prime example is the Dow Jones Industrial Average (DJIA) in the U.S.
During the 2008 financial crisis, the DJIA formed a very clear Head and Shoulders pattern. At that time, many investors recognized this pattern and used it to sell before the price dropped sharply. The neckline of this pattern was confirmed by a candlestick close below the support level, and the index then dropped more than 50% throughout 2008, bringing huge profits to those who correctly identified the pattern and applied a sound trading strategy.
However, without careful analysis, it is easy to be “trapped” by sudden market events. An event can cause this pattern to “break” quickly, leading to unnecessary losses.
Contrarian View: The Head and Shoulders Pattern Can Lead to Profit, But the Risk Is High
There is a contrarian view of the Head and Shoulders pattern in that it can pose significant risk if not used correctly. While this pattern is often considered an excellent tool for identifying reversals, there are cases where it leads to failure for inexperienced traders.
In practice, using the Head and Shoulders pattern without confirming it with other indicators can lead to price traps. For example, a perfect Head and Shoulders pattern can be broken if there is no confirmation from other tools like the RSI or MACD, making the pattern meaningless.

DLMvn > Trading Indicators > Head And Shoulders Pattern: How To Identify Reversal Signals
Expand Your Knowledge in This Area
Trading Indicators
Engulfing Pattern: A Reversal Signal in Technical Analysis
Trading Indicators
4 Ways to Leverage Support and Resistance for Optimal Trading
Trading Indicators
Hanging Man: A Reversal Candlestick Pattern
GlossaryTrading Indicators
Moving Averages – A Comprehensive Overview
Trading Indicators
What is the Shooting Star Candlestick Pattern? Meaning and How to Identify It
Trading Indicators
Evaluating the Dark Cloud Cover Candlestick Pattern: Opportunity or Trap for Investors?