TABLE OF CONTENTS
- What is the Dark Cloud Cover Candlestick Pattern?
- How to Identify the Dark Cloud Cover Pattern on a Chart
- How to Trade with the Dark Cloud Cover Candlestick Pattern
- Advantages and Disadvantages of the Dark Cloud Cover Candlestick Pattern
- Challenges when Trading with the Dark Cloud Cover Pattern
- Contrary View on the Dark Cloud Cover Pattern
- Differences Between Candlestick Patterns
- How to Combine the Dark Cloud Cover Pattern with Other Technical Analysis Tools
- Challenges and Risk Management Strategies When Trading the Dark Cloud Cover Pattern
The Dark Cloud Cover candlestick pattern is one of the popular tools used by traders to identify reversal signals in the financial markets. However, like any technical analysis tool, it doesn’t always provide the expected results. So, is this pattern truly an opportunity or a trap for investors? Let’s explore this with DLMvn.
What is the Dark Cloud Cover Candlestick Pattern?
The Dark Cloud Cover candlestick pattern signals the potential for a bearish reversal. It appears at the peak of an uptrend and consists of two candles: a long bullish candle (green), followed by a bearish candle (red). What makes this pattern unique is that the bearish candle closes below 50% of the preceding bullish candle’s body, indicating a shift in momentum from the buyers to the sellers.
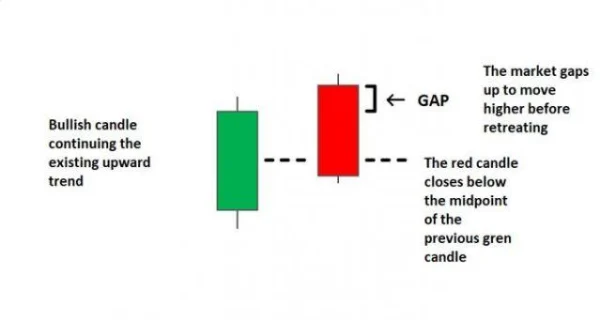
It is worth noting that although this pattern resembles the Bearish Engulfing pattern, there is a crucial difference. The bearish candle in the Dark Cloud Cover pattern closes higher than the bearish candle in the Bearish Engulfing pattern. Therefore, the Dark Cloud Cover pattern is often considered a more attractive signal for entry.
How to Identify the Dark Cloud Cover Pattern on a Chart
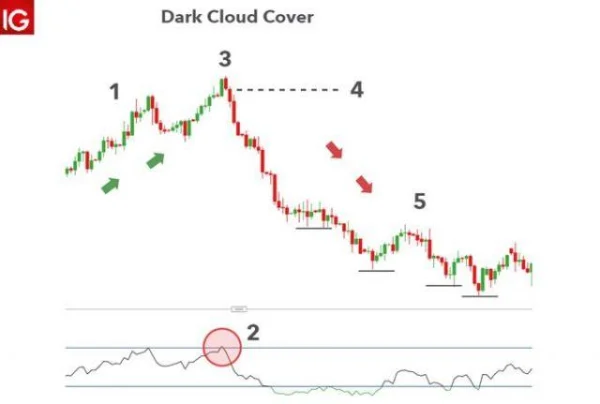
To identify the Dark Cloud Cover pattern, traders need to follow several important steps:
- Identify the current uptrend: Before this pattern appears, make sure the market is in a clear uptrend.
- Monitor momentum slowing down: You can use indicators like Stochastic or moving average crossovers to identify signs of a reversal.
- Observe the gap between the candlesticks: In stock markets, there will be a gap between the two candles.
- Check the closing price of the bearish candle: Ensure the bearish candle closes below 50% of the previous bullish candle’s body, signaling the shift of control from the buyers to the sellers.
- Confirm the bearish trend: After the pattern appears, if there is further confirmation from indicators or price action, you can confidently trust the reversal signal.
How to Trade with the Dark Cloud Cover Candlestick Pattern
The Dark Cloud Cover pattern can be applied in both trending and sideways markets. Below are some strategies for trading with this pattern:
1. Trending Market
When the market is in a strong uptrend, the Dark Cloud Cover pattern can be considered a clear signal for a reversal. For example, in the GBP/USD pair, when this pattern appears, you can enter a sell order as soon as the red candle closes below 50% of the previous green candle. This indicates that the sellers have started to take control of the market.
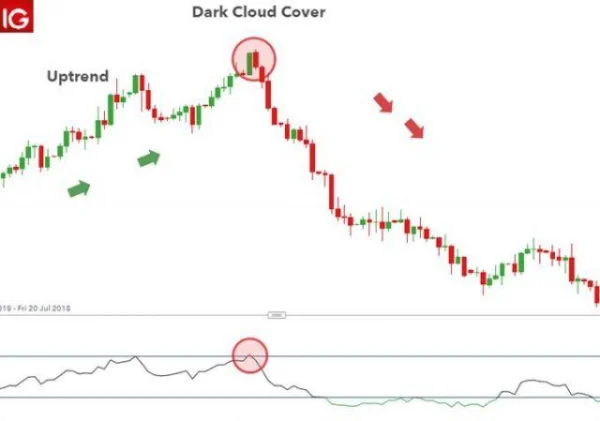
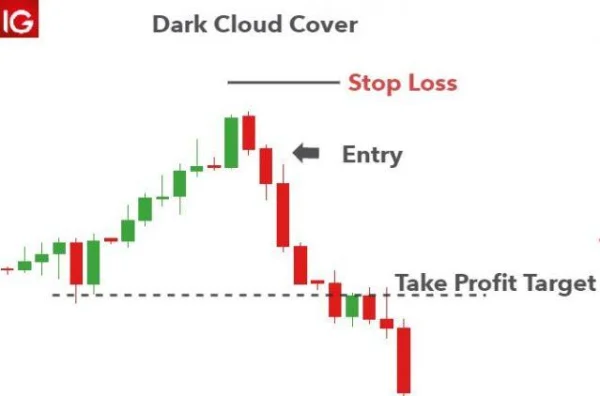
The entry point can be set at the open of the next bearish candle, while the stop-loss can be placed at the highest point of the Dark Cloud Cover pattern. Traders can set multiple price targets based on nearby support/resistance areas.
2. Sideways Market
In a sideways market, the Dark Cloud Cover pattern appearing near resistance levels can provide a short-term signal. For example, when the GBP/USD pair is moving in a narrow range, the appearance of the Dark Cloud Cover pattern near a resistance level could signal a short-term bearish trend. However, because a sideways market can cause prices to fluctuate within a range, you need to be very cautious and check additional indicators like RSI or MACD to confirm this signal.
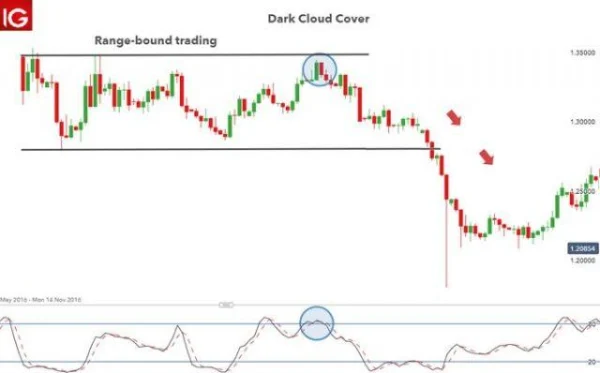
Advantages and Disadvantages of the Dark Cloud Cover Candlestick Pattern
Like all technical analysis tools, the Dark Cloud Cover pattern has both advantages and disadvantages. Here is an overview:
Advantages
- Attractive entry point: This pattern appears at the peak of an uptrend, providing an opportunity to enter a sell position with a high risk/reward ratio.
- Better risk/reward ratio compared to Bearish Engulfing: Since the bearish candle in the Dark Cloud Cover does not fully engulf the previous bullish candle, it creates a lower risk level while still maintaining a high potential for profit.
- Easy to identify for new traders: This pattern is not too complex to identify, making it accessible for novice traders to use effectively.
Disadvantages
- Should not be used in isolation: This pattern is only truly strong when combined with other technical indicators or price action to confirm the reversal signal.
- Requires technical analysis knowledge: Traders need to understand how to use supporting indicators such as Stochastic, RSI, or MACD to confirm the signal, otherwise, the pattern can be less reliable.
- Position of appearance is crucial: The pattern is only reliable when it appears at the peak of an uptrend. If it appears in the middle of a trend, its accuracy may decrease.
Challenges when Trading with the Dark Cloud Cover Pattern
Although this pattern can help identify potential entry points, trading based on it still has its challenges. One of the biggest challenges is that the market does not always move in the direction predicted by the pattern. Particularly in volatile or trendless markets, the Dark Cloud Cover pattern can give false signals.
For example, in a study of the US stock market, the Dark Cloud Cover pattern indicated a reversal in 70% of cases when combined with the RSI indicator, but in cases without any additional indicators, the success rate was only 50%. Therefore, combining this pattern with other technical factors is crucial to increase its reliability.
Contrary View on the Dark Cloud Cover Pattern
The Dark Cloud Cover pattern does not always guarantee profits. One of the major issues is the “delay” of the signal. Contrary to what some may think, the appearance of this pattern does not always lead to a strong reversal.
For example, in the U.S. stock market, the Dark Cloud Cover pattern can sometimes appear after a long price increase but does not immediately result in the expected reversal. In a study of 500 stocks from the S&P 500 index, the success rate of this pattern was only 55%, meaning nearly half of the trades were unsuccessful. This is especially true when the market is in a strong trend with no clear signs of a reversal.
1. Market Volatility and Situation
It is important to be aware of the specific market conditions when this pattern appears. In a high-volatility market, such as the global stock market during the COVID-19 pandemic, the Dark Cloud Cover pattern may create a failed reversal signal. For instance, when the U.S. stock market experienced a crash in March 2020, many candlestick patterns, including Dark Cloud Cover, appeared and signaled a bearish reversal. However, those steep declines were quickly offset by economic stimulus packages and market recovery, making the signal unreliable.
2. Short-Term Volatility
In today’s volatile market, where political, economic events, or even news can strongly affect prices, the Dark Cloud Cover pattern sometimes only reflects a short-term fluctuation rather than a long-term trend reversal. For example, in late 2018, when global stocks dropped sharply due to concerns over the U.S.-China trade war, the Dark Cloud Cover pattern appeared on major stock indices. However, those price declines only lasted a few weeks before the market quickly recovered, supported by macroeconomic factors.
Differences Between Candlestick Patterns
The Dark Cloud Cover pattern is often compared with other candlestick patterns, such as Bearish Engulfing and Evening Star. While all three patterns signal a reversal from bullish to bearish, the difference lies in their reliability and how they appear on the chart.
For example, the Bearish Engulfing pattern has a relatively high success rate in strongly trending markets, but this rate decreases when the market is in a sideways phase. Meanwhile, the Dark Cloud Cover pattern can provide better entry signals when combined with supporting indicators like RSI or MACD, especially in markets with light volatility or correction phases.
How to Combine the Dark Cloud Cover Pattern with Other Technical Analysis Tools
An effective strategy for trading with the Dark Cloud Cover pattern is to combine it with technical indicators. Indicators such as RSI (Relative Strength Index) or MACD (Moving Average Convergence Divergence) can further confirm the strength of the reversal signal.
- RSI can help you identify whether the market is overbought or oversold. When the RSI exceeds 70, it may indicate that the market is overbought, and the appearance of the Dark Cloud Cover pattern could be a sign of a reversal.
- MACD can provide confirmation when the MACD line crosses below the signal line, reinforcing the bearish signal generated by the Dark Cloud Cover pattern.
For instance, in 2018, when the EUR/USD pair formed the Dark Cloud Cover pattern, RSI indicated that the market was overbought, and MACD also confirmed a strong decline. Combining these factors helped traders make an accurate bearish entry, taking advantage of the subsequent drop in the currency pair.
Challenges and Risk Management Strategies When Trading the Dark Cloud Cover Pattern
There is no denying that the Dark Cloud Cover pattern can bring high profits, but traders need to manage risk wisely. One of the major challenges is confirming the signal. This pattern needs additional confirmation from price action or other indicators to increase its reliability. Relying solely on this pattern without proper confirmation could lead to failure.
An important risk management strategy is to use appropriate stop-loss levels. If you’re trading with the Dark Cloud Cover pattern, setting your stop-loss at the highest point of the previous candlestick is an effective way to protect your capital. At the same time, set your take-profit target at the nearest support or resistance zones.
Remember, no pattern is perfect, and no trade guarantees 100% profit. Therefore, you need a flexible trading strategy, always ready to adjust as market conditions change.
Thus, the Dark Cloud Cover pattern can be a very useful tool in your trading strategy if applied correctly. However, accurately evaluating the signals and combining them with other factors such as technical indicators, price action analysis, and risk management are the key to success. Remember, in the stock market, nothing is certain, and every trading decision carries risks.

DLMvn > Trading Indicators > Evaluating the Dark Cloud Cover Candlestick Pattern: Opportunity or Trap for Investors?
Expand Your Knowledge in This Area
Trading Indicators
Essential Technical Indicators Every Trader Should Master
Trading Indicators
Discover How to Combine Moving Averages with Candlestick Patterns Effectively
Trading Indicators
Technical Analysis Indicators Groups: Understanding Their Differences and Applications
Trading Indicators
Double Bottom Pattern Signals an Uptrend
Trading Indicators
Simple Trading Strategy with Support and Resistance
Trading Indicators
4 Ways to Leverage Support and Resistance for Optimal Trading