TABLE OF CONTENTS
- What is the Engulfing Candlestick Pattern?
- Why is the Engulfing Candlestick Pattern Important for Traders?
- Trading Strategies with the Engulfing Candlestick Pattern
- Analysis of the Engulfing Pattern in Global Markets
- Engulfing Pattern and Real-World Challenges
- Contrary Viewpoint: Is the Engulfing Pattern Always Reliable?
- Incorporating the Engulfing Pattern into Your Trading Strategy
The Engulfing candlestick pattern is one of the prominent technical analysis tools that every trader must familiarize themselves with when entering the stock market. Beneath the surface of numbers and charts, this pattern serves as a “key” that reveals potential trend reversal signals, unlocking opportunities for profitable trades.
What is the Engulfing Candlestick Pattern?
The Engulfing candlestick pattern is a strong signal in technical analysis, indicating a reversal of the market trend. The structure of this pattern is quite simple but holds valuable information: it consists of two candlesticks, with the second candlestick completely “engulfing” (covering) the body of the first one. However, what matters is not just the structure, but the context in which the pattern appears. When this pattern shows up during a trending market, it could signal a strong reversal.
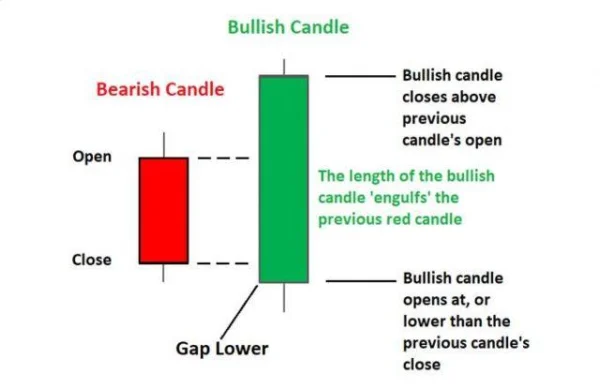
1. Bullish Engulfing Candlestick Pattern
The Bullish Engulfing pattern typically occurs when the market is in a downtrend, and this is when traders often look for reversal signals. The second candlestick in this pattern has a long green body, completely covering the preceding red candlestick. This strong shift from bearish to bullish signals an increase in buying pressure, potentially ending the downtrend.
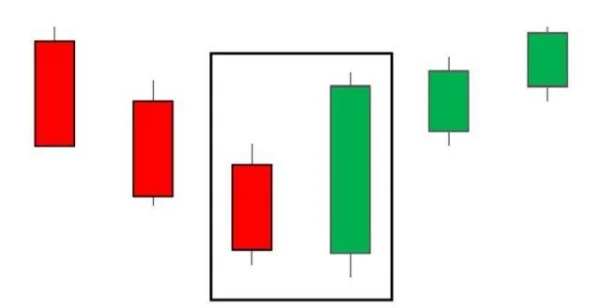
The Bullish Engulfing pattern is only truly effective when confirmed by subsequent price action. A strong bullish candlestick is a signal of buyer participation, but without continuation, traders could easily fall into a “trap”. By combining other indicators like RSI or MACD and monitoring support and resistance levels, you can increase the probability of a successful trade.
2. Bearish Engulfing Candlestick Pattern
In contrast to the Bullish Engulfing pattern, the Bearish Engulfing pattern occurs when the market is in an uptrend, signaling a reversal from bullish to bearish. The second candlestick in this pattern is a long red candle, completely engulfing the preceding green candlestick, indicating strong seller involvement.
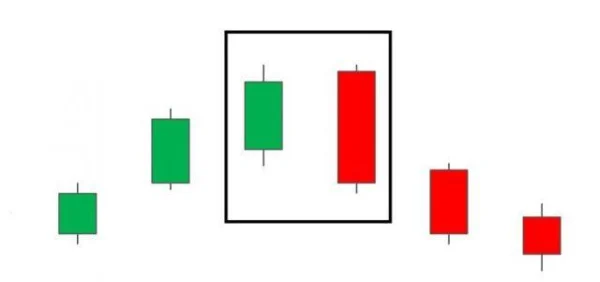
One of the reasons the Bearish Engulfing pattern is so noteworthy is that it often appears at high price levels, signaling a change in supply and demand on the market. However, like all reversal patterns, the Bearish Engulfing pattern doesn’t always lead to a strong reversal unless confirmed. Remember, not all candlestick patterns will succeed, and monitoring the next price action is crucial.
Why is the Engulfing Candlestick Pattern Important for Traders?
It’s no surprise that the Engulfing candlestick pattern is highly regarded among traders because it provides three extremely important signals:
- Trend Reversal: This is the most obvious application of the Engulfing pattern. Identifying the reversal early allows you to enter trades at the best prices, maximizing profits.
- Trend Continuation Confirmation: Sometimes, the Engulfing pattern doesn’t signal a reversal but rather the continuation of the current trend. A Bullish Engulfing pattern in a strong uptrend may increase confidence that the price will continue to rise.
- Exit Signal: The Engulfing pattern can also help traders identify when to exit the market, especially when signs indicate that the current trend is nearing its end.
However, this pattern is not always accurate. It’s a fact that the Engulfing candlestick pattern can sometimes pull back before truly signaling a reversal. At this point, using supporting tools like momentum indicators or monitoring the next support and resistance levels becomes crucial.
Trading Strategies with the Engulfing Candlestick Pattern
1. Reversal Strategy
With the Bearish Engulfing pattern, you can wait for confirmation from the next price action before entering a trade. The trading strategy is fairly simple: when the price closes below the low of the Bearish Engulfing candlestick, it could be the right time to start a sell trade. If there’s a slight price dip beforehand, you can also take advantage of this opportunity to enter a sell trade at a better price.
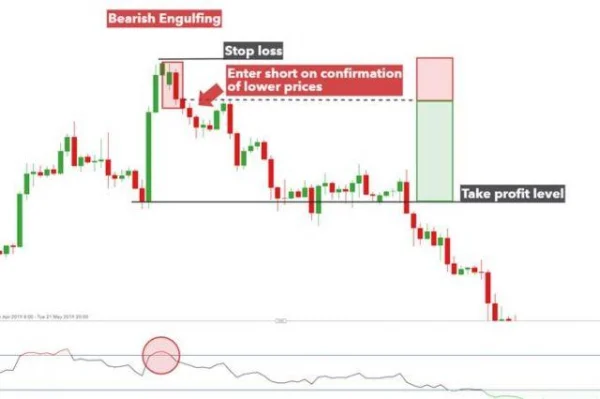
- Entry: You can enter the trade when the price closes below the low of the Bearish Engulfing candlestick.
- Stop Loss: The stop-loss level can be set above the high of the Bearish Engulfing pattern.
- Target Profit/Take Profit Level: The previous support level can be the target, ensuring a reasonable risk/reward ratio.
2. Trend Following Strategy (Trend Trading)
The Engulfing candlestick pattern doesn’t always signal a reversal; sometimes it simply confirms the momentum of the current trend. A typical example is the appearance of multiple Bullish Engulfing patterns in a strong uptrend. These patterns reinforce traders’ confidence in the trend continuing.
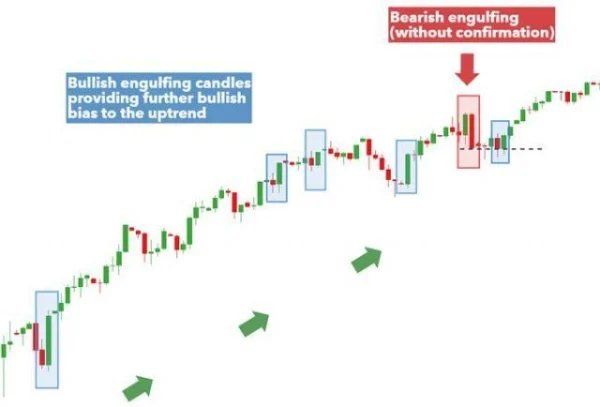
In this scenario, even though a Bearish Engulfing pattern appears at the peak of the trend, the market continues to rise, as the subsequent candlesticks do not close below the low of the Bearish Engulfing pattern. This highlights the importance of confirming the pattern before making any trade decisions.
Analysis of the Engulfing Pattern in Global Markets
Not every time does the Engulfing candlestick pattern provide an accurate signal, especially when you solely rely on a single candlestick pattern without considering other macro factors. Major markets, like the U.S. stock market, including indices like the S&P 500 or NASDAQ, frequently show appearances of the Engulfing pattern, but sometimes it merely represents a “false signal” compared to the broader trend. This pattern is usually most effective in clear trends with short-term corrections, but it doesn’t always signal a long-term reversal.
Take the example of the Bullish Engulfing pattern on the S&P 500 index in March 2020. After the index experienced a sharp decline due to market panic amid the COVID-19 pandemic, a Bullish Engulfing pattern emerged. The strong green candlestick right after a long red candlestick made many traders see a strong reversal signal. However, relying solely on this pattern, they may have overlooked other macro factors like the Federal Reserve’s monetary policies, pandemic-related fluctuations, or fiscal stimulus factors.
This demonstrates that in such a volatile market, the Engulfing pattern cannot just be a “signal” for trend direction but needs to be combined with other factors to improve accuracy. Professional traders not only look at candlestick patterns but also deeply analyze the broader market context.
Engulfing Pattern and Real-World Challenges
The reality is that, in some situations, the Engulfing pattern might reflect a temporary price pullback, rather than a complete reversal as many traders expect. Stock markets can create large waves, making the Engulfing pattern just a “trap” for those who oversimplify their analysis.
For example, in the U.S. stock market in October 2018, after the Bearish Engulfing pattern appeared on the Dow Jones Industrial Average, many traders quickly sold off. However, the index soon recovered and continued strong growth. This demonstrates that patterns like Engulfing can be broken by short-term factors, and relying on this pattern alone without understanding the broader context and other indicators can cause you to miss trading opportunities.
Additionally, one issue that not everyone notices when using this pattern is the “quick market response.” When an Engulfing pattern appears, many traders simultaneously recognize the signal and act on it. This creates a “wave effect,” increasing the risk for those trading with the crowd without a solid risk management strategy.
Contrary Viewpoint: Is the Engulfing Pattern Always Reliable?
Many may agree with the view that while the Engulfing pattern is popular, it is sometimes overused and not always reliable. Long-term investors, especially those involved in index funds or buy-and-hold strategies, rarely rely on this candlestick pattern as a primary indicator. The simple reason is that this pattern reflects short-term movements and doesn’t represent long-term trend direction.
Macroeconomic analysts, such as those working at JP Morgan or Goldman Sachs, look at economic indicators, company financial reports, or global economic policies to make more accurate forecasts, rather than relying on a single candlestick pattern. This shows that the Engulfing candlestick pattern, although powerful in short-term trading, is not the only method for making long-term investment decisions.
Incorporating the Engulfing Pattern into Your Trading Strategy
The Engulfing pattern can be extremely effective when used as part of a combined trading strategy. To increase the accuracy of this pattern, you can combine it with other indicators, such as Moving Average (MA), Relative Strength Index (RSI), or Bollinger Bands.
For example, when using the Bullish Engulfing pattern, you can seek additional confirmation from the RSI, provided the RSI is not in the overbought zone. If the RSI still has room to increase, this could indicate that the Engulfing pattern is not just signaling a pullback but is truly the start of a strong upward trend.
Another notable example occurred in June 2019, when the Bearish Engulfing pattern appeared on Tesla stock. However, the stock rose sharply afterward, driven by new product announcements and actions from CEO Elon Musk. The Bearish Engulfing pattern here could have misled traders if they hadn’t analyzed additional external factors impacting the stock’s value.

DLMvn > Trading Indicators > Engulfing Pattern: A Reversal Signal in Technical Analysis
Expand Your Knowledge in This Area
Trading Indicators
Decoding Overbought and Oversold Phenomena: What Do They Mean?
Trading Indicators
An Introduction to the 5 Doji Candle Patterns
GlossaryTrading Indicators
Stochastic Oscillator: An Effective Tool For Forecasting Market Trends
Trading Indicators
What Is Price Action? A Basic Guide to Understanding This Method
Trading Indicators
Piercing Line and How to Use It for Market Top/Bottom Reversal in Trading
Trading Indicators
Inside Bar: A Powerful Candlestick Pattern for Identifying Entry Points