Ralph Nelson Elliott And The Origins Of The Theory
Going back to the 1920s – 1930s, Ralph Nelson Elliott, an accountant and passionate market analyst, began his journey to decode the cycles of the financial market. He analyzed data spanning 75 years and noticed that although the stock market seemed to operate chaotically, it actually followed clear recurring rules.
At the age of 66, Elliott introduced his research through the book The Wave Principle. He explained that price fluctuations not only reflect external factors such as economic news but are also the result of investor psychology. The cycles of price rises and falls, according to Elliott, are manifestations of “waves” – the key elements to predict future price trends.
Elliott provided traders with a powerful tool: the ability to identify potential turning points in price. This is why Elliott Wave Theory became one of the most important forecasting methods in modern technical analysis.
5-3 Impulse Wave Model
Elliott divided price movements into two main types:
- Impulse Waves: Consisting of the first 5 waves, moving in the direction of the main trend.
- Corrective Waves: Consisting of the last 3 waves, moving against the direction of the main trend.
The Elliott wave model is effectively applied not only to stocks but also to other assets like bonds, gold, or crude oil. However, we will focus on the analysis within the context of the stock market.
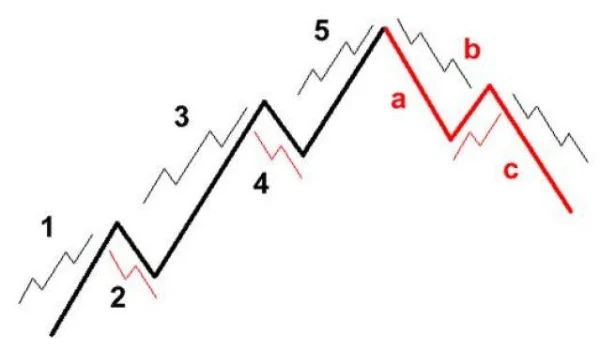
Wave 1
The first price increase occurs when a small group of traders sees the stock as undervalued and starts buying in. This pushes the price up, but not enough to attract widespread attention.
Wave 2
After the price rises, some early investors decide to take profits, causing the price to correct downward. However, this decline is not enough to return to the initial starting point.
Wave 3
This is the strongest phase, as positive information spreads and attracts public attention. The stock price rises sharply, often surpassing the peak of Wave 1. Wave 3 is typically the longest and strongest of the three impulse waves.
Wave 4
A mild correction appears as some traders start taking profits. However, the market maintains an optimistic outlook, and many other investors see this as an opportunity to buy.
Wave 5
This is the “blow-off” phase, when the crowd gets swept up in euphoric sentiment. The price rises sharply, but it is often a sign that a major correction is imminent. Savvy investors begin to exit, and a corrective ABC pattern may appear shortly after.
Expansion Wave Phenomenon
In the three impulse waves (1, 3, 5), one of them may extend longer than the other two, forming a smaller internal wave structure of 5 waves. Usually, Wave 3 or Wave 5 exhibits this characteristic. This expansion phenomenon signals strong market participation, creating opportunities but also associated risks.
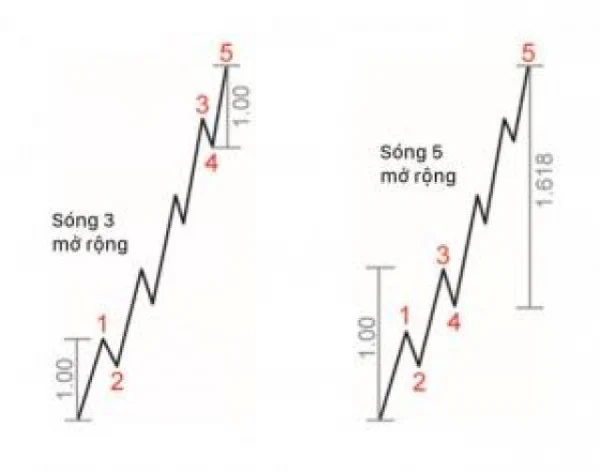
When an expansion wave occurs, you should combine technical indicators like RSI or MACD to assess the strength of the trend. This helps you avoid false signals or unclear turning points.
5-3 Wave Structure And The Role Of Corrective Waves
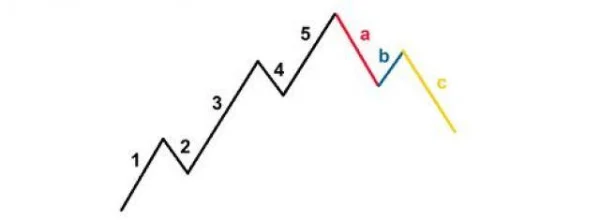
In a trend, the 5 impulse waves are typically followed by a correction in the form of the 3 ABC corrective waves. The letters ABC are used to mark the correction phase, distinguishing it from the numbered waves in the impulse structure. Let’s dive deeper into the details through the model below.
1. The ABC Corrective Wave Model
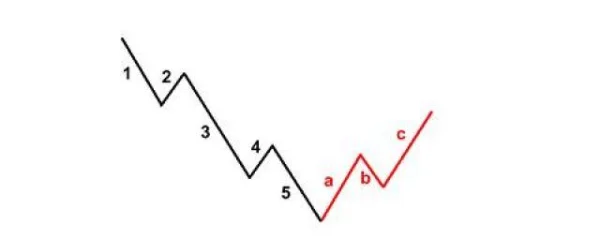
When analyzing an uptrend, the corrective wave model usually appears after the completion of the 5-wave impulse. However, this theory is also applicable in a downtrend. In a downtrend, the 5-3 model works similarly, but the waves are reversed in relation to the uptrend.
2. Main Corrective Wave Patterns
According to Elliott, there are a total of 21 corrective wave patterns, including both simple and complex forms. Despite their large number, most of them are just variations of 3 basic models, which include:
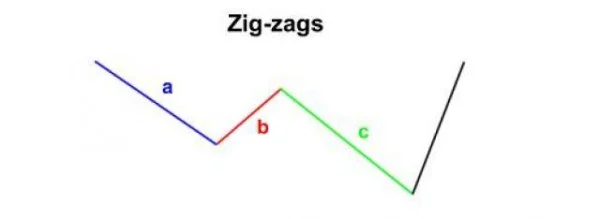
Zig-Zag Model
The Zig-Zag model represents a very steep correction, moving against the main trend. In this model:
- The B wave is usually shorter than both the A and C waves.
- There may be 2 or 3 consecutive Zig-Zag models, forming a double wave.
- Each wave in the Zig-Zag model is typically subdivided into 5 smaller impulse waves.
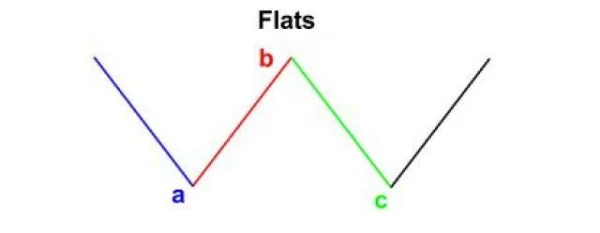
Flat Model
The flat model represents a sideways correction, in which:
- The lengths of waves A, B, and C are typically about the same.
- The B wave sometimes exceeds the starting point of the A wave.
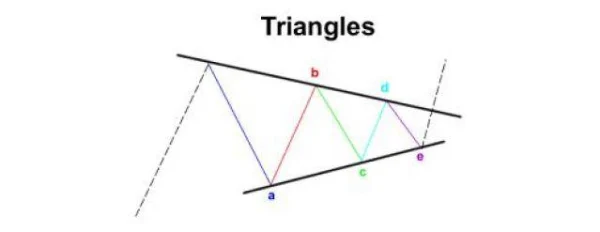
Triangle Model
The triangle model represents a sideways correction within a narrow range, bounded by two converging or diverging trendlines.
- The triangle structure consists of 5 smaller waves, moving against the main trend.
- Triangle types can include: symmetrical triangles, ascending triangles, descending triangles, or expanding triangles.
The Fractal Nature Of Elliott Waves
The Elliott Wave Theory is distinguished by its fractal nature – each large wave is made up of smaller waves.
Waves Within Waves
Each wave 1, 3, and 5 in the impulse structure contains smaller 5-wave impulse patterns, while waves 2 and 4 are formed from 3-wave corrective patterns. This rule repeats across multiple levels:
- Supercycle waves: Comprising multiple cycle waves.
- Cycle waves: Comprising main waves.
- Primary waves: Comprised of intermediate waves.
- Intermediate waves: Comprised of smaller waves.
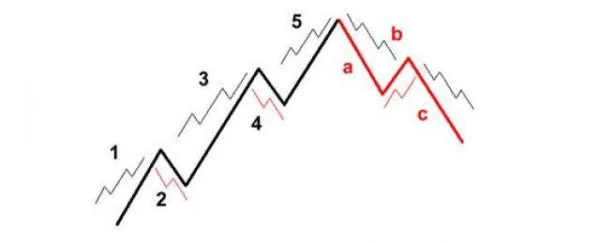
You can observe this fractal nature across different timeframes such as MN1, W1, D1, H4, H1, or M15.
Three Golden Rules of Elliott Waves
To effectively apply Elliott Wave Theory, accurately identifying the waves is a must. There are 3 crucial rules that must not be broken:
- Wave 3 can never be the shortest wave among the impulse waves.
- Wave 2 can never exceed the starting point of Wave 1.
- Wave 4 can never enter the price range of Wave 1.
Additional Guidance
In addition to the rules, there are some useful tips for counting waves:
- Sometimes, Wave 5 does not surpass the endpoint of Wave 3, a phenomenon known as truncation.
- Wave 3 is typically long, strong, and expands into 5 smaller waves.
- Wave 2 and Wave 4 often retrace from specific Fibonacci retracement levels, creating clear trading opportunities.
It is recommended to use Fibonacci tools in conjunction with Elliott Wave Theory to identify potential price reversal zones, especially when Waves 2 and 4 form. This enhances the accuracy of entry and exit point predictions.
In-Depth Analysis of Elliott Wave Theory: Models and Challenges
1. Elliott Wave Theory – The Repetition of Market Sentiment
Elliott Wave Theory is not just a technical tool, but actually reflects market sentiment and crowd psychology in trading. According to Elliott, investor emotions tend to repeat in cycles. The impulse and corrective waves are manifestations of these emotions, from greed in the upward waves (1, 3, 5) to fear in the corrective waves (2, 4, ABC). This makes the theory a powerful tool for market forecasting, but it can also be misleading if not fully understood.
Since stock markets do not always behave in the “perfect” way described by the theory, many argue that Elliott Wave Theory is subjective and difficult to apply in practice. However, viewing the waves as flexible space intervals rather than fixed systems allows investors to spot signals to make decisions.
2. Elliott Wave Theory and Bear Markets
One of the interesting aspects of Elliott Wave Theory is its applicability in both bull and bear markets. In a bear market, the theory can still help forecast price movements, with the 5-wave impulse still following a certain trend, although the corrective process is different. However, in reality, many traders find it difficult to apply accurately in strong bear markets, especially when the stock market is impacted by macroeconomic factors like economic recessions or financial crises.
3. The Challenge of Wave Identification
One reality is that correctly identifying waves is a significant challenge. This is especially true when trading on smaller timeframes, where wave structure accuracy can be ambiguous and prone to misdirection. In fact, many investors have encountered this issue when attempting to apply Elliott Wave Theory to short-term trading decisions. For instance, while Wave 3 is considered the strongest wave, in some cases, the market might move against the theory, causing investors to easily lose money when applying the theory without flexibility and deep understanding of market signals.
4. Difficulties in Accurate Forecasting and Analysis
The most important aspect of Elliott Wave Theory is the ability to predict the peaks and troughs of a trend. However, this theory is not always completely accurate. Some studies show that wave patterns may not repeat exactly in all situations, making forecasting market reversals quite challenging. While the theory suggests that a trend will unfold in 5-3 waves, in some cases, only 4 waves or even 6 waves occur. This means that investors need to possess patience and be ready to adjust trading strategies to minimize mistakes.
5. The Relationship Between Fibonacci and Elliott Waves
One of the key elements supporting Elliott Wave Theory is Fibonacci retracement. Fibonacci levels are used to predict support and resistance levels in a trend, creating a powerful synergy with Elliott Wave Theory. For example, Waves 2 and 4 often retrace from specific Fibonacci retracement levels. However, using Fibonacci can be a double-edged sword. In practice, there are times when Fibonacci levels do not accurately reflect a correction, leading to misunderstandings and poor decisions.
Nonetheless, when combining Fibonacci with Elliott Waves, you can create potential price zones for trading. These zones can serve as entry points or more precise exit points. Some experts recommend combining Fibonacci with other technical indicators to increase accuracy and reduce errors.
If you’re using Elliott Wave Theory in short-term trading, make sure you always check larger timeframes such as H4, D1 to identify the main waves. This will help you avoid false signals from smaller timeframes and provide a more comprehensive view of the market trend.
6. The Importance of Knowledge and Experience
As a conclusion to Elliott Wave Theory, while it can present great opportunities for investors, nothing is guaranteed in trading. This theory requires a perfect combination of technical knowledge and real-world experience. It is not always easy to apply, and those lacking experience can easily make mistakes when trying to count waves without considering other market factors. Therefore, DLMvn always encourages you to practice continuously, learn from mistakes, and adjust your trading strategy to fit specific market conditions.

DLMvn > Trading Indicators > Discovering Elliott Wave Theory: The Foundation of Market Forecasting Art
Expand Your Knowledge in This Area
Trading Indicators
What is the Shooting Star Candlestick Pattern? Meaning and How to Identify It
Trading Indicators
An Introduction to the 5 Doji Candle Patterns
Trading Indicators
Smart Trading With Bullish and Bearish Engulfing Patterns
Trading Indicators
Essential Knowledge for Interpreting Divergence Signals
Trading Indicators
What Are Lagging Indicators? A Comprehensive Guide And Practical Applications
Trading Indicators
Trade Smarter with Long Wick Candles