TABLE OF CONTENTS
- What is the Rising Wedge Pattern?
- What is the Falling Wedge Pattern?
- Advantages and Disadvantages of Using the Wedge Pattern
- Challenges When Using the Wedge Pattern
- Contrary Views on the Wedge Pattern
- Things to Consider When Trading with the Wedge Pattern
- Success Rate and Challenges of the Wedge Pattern
- Opportunities and Risks
The wedge pattern, although simple in form, is extremely useful and easy to recognize for traders in the stock market. It is a powerful tool for identifying trends and entry points. Today, DLMvn will provide you with a more detailed look at the wedge pattern, how to recognize it, and how to apply it in real trading.
What is the Rising Wedge Pattern?
The rising wedge is a common accumulation pattern typically seen in a bearish market. It forms when the price fluctuates within a channel with two converging trendlines—one upward (forming the lower edge of the wedge) and one downward (forming the upper edge of the wedge). Simply put, this pattern signals a weakening of the current uptrend and may indicate a potential reversal to the downside.
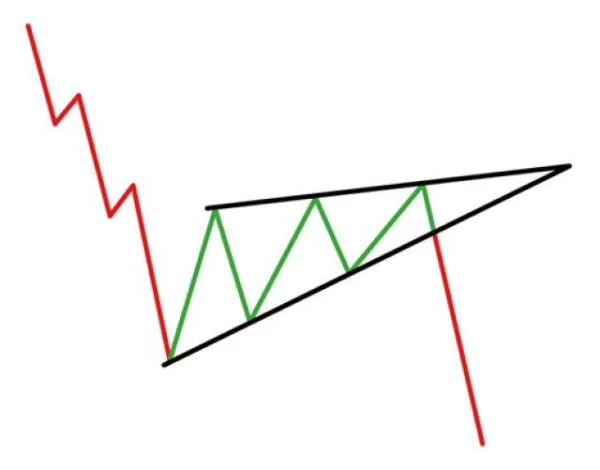
When analyzing the rising wedge pattern, it’s important to understand two key concepts: continuation patterns and reversal patterns. Each has its own method of identification and distinguishing signals.
1. How to Identify the Rising Wedge Pattern
-
Continuation Pattern: This pattern typically appears during a strong downtrend. When the price accumulates within a rising wedge, traders can look for an opportunity to enter a short position when the price breaks below the support trendline.
-
Reversal Pattern: On the other hand, if the rising wedge appears during a strong uptrend, it may signal a reversal, and traders will look for short opportunities when the price breaks below the lower edge of the wedge.
An important factor you cannot overlook is divergence between price and volume. If you look at indicators like the MACD, you’ll notice that trading volume often decreases during the formation of the wedge, signaling a weakening of the current trend.
In the US stock market, at the end of 2018, many stocks in the S&P 500 index formed rising wedge patterns, leading to a strong reversal in 2019. A typical example is Amazon stock, where the rising wedge pattern appeared during the uptrend from 2017 to 2018 before the price declined sharply.
2. How to Trade with the Rising Wedge Pattern
To trade with the rising wedge pattern, you can use one of two methods:
-
Wait for a Candle Close Below the Lower Edge of the Wedge: You can enter a trade after seeing a candle close below the lower edge of the wedge, confirming the breakout and the likelihood of the downtrend continuing.
-
Enter a Short Position as Soon as the Price Breaks Below the Lower Edge: When the price breaks below the lower edge of the wedge, you can enter a trade immediately, with your stop-loss set at the highest point of the pattern.
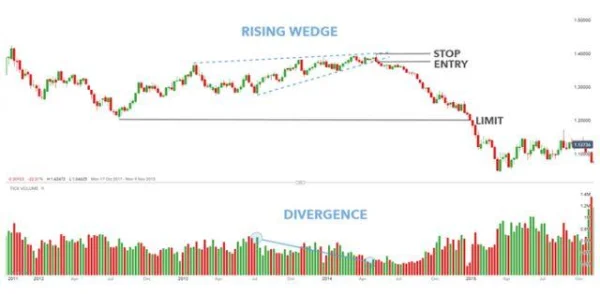
DLMvn previously applied this strategy when trading Tesla stock in mid-2019, where the rising wedge pattern accurately predicted the bearish reversal, yielding significant profits for traders.
What is the Falling Wedge Pattern?
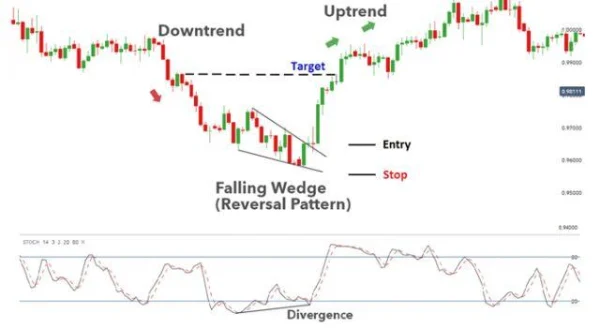
The falling wedge pattern is similar in form to the rising wedge, but instead of accumulating in a downtrend, it forms during an uptrend or a corrective phase of a downtrend. The falling wedge typically signals a potential bullish reversal or continuation of the uptrend, depending on where it appears.
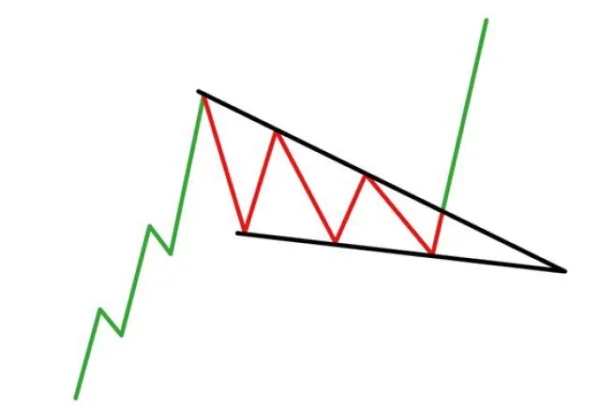
1. How to Identify the Falling Wedge Pattern
-
Bullish Continuation Pattern: If this pattern appears during a strong uptrend, it may indicate the continuation of the uptrend when the price breaks above the upper edge of the wedge.
-
Bullish Reversal Pattern: When the falling wedge appears during a downtrend, it can be a signal of a bullish reversal.
An important aspect of using the falling wedge pattern is confirming the signals with indicators like the RSI or Stochastic. If these indicators show oversold conditions, you may look for a long (buy) entry when the price breaks above the upper edge of the wedge.
In 2020, Netflix stock formed a falling wedge pattern during a mild correction phase. After the price broke above the upper edge of the wedge, the stock surged significantly, providing substantial profits for traders who applied this strategy.
2. How to Trade with the Falling Wedge Pattern
When trading with the falling wedge pattern, you may encounter a common issue known as “Fake Out”—where the price breaks above the upper edge of the wedge but then reverses back into the pattern. To avoid this, you should place your stop-loss appropriately to prevent being stopped out in the case of a fake-out.
Bullish Continuation Pattern: For the continuation pattern, you can enter a trade as soon as the price breaks above the upper edge of the wedge. The profit target can be measured by the height of the wedge pattern.
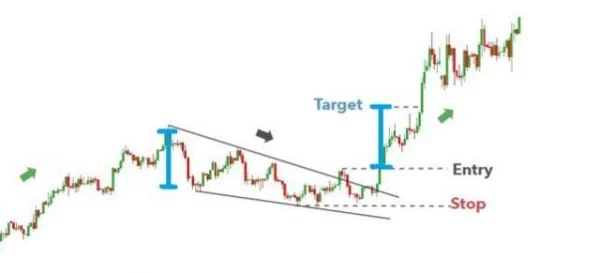
Bullish Reversal Pattern: In the case of a reversal, you can enter a long position when the price breaks above the upper edge of the wedge, but make sure to adjust your stop-loss to ensure a proper risk-reward ratio.
Advantages and Disadvantages of Using the Wedge Pattern
Advantages:
- The wedge pattern is easy to identify and appears quite frequently in trading.
- Entry points, stop-loss, and profit-taking levels are clear, helping traders easily develop strategies.
- It offers opportunities for attractive risk/reward ratios, especially in strongly trending markets.
Disadvantages:
- The pattern can sometimes be unclear and difficult to identify for novice traders.
- It requires confirmation from other tools, such as technical indicators, to ensure the accuracy of the pattern.
Challenges When Using the Wedge Pattern
Need for Confirmation Through Other Indicators: The wedge pattern does not always provide clear signals, especially for new traders. Therefore, relying solely on the wedge pattern without combining it with other tools like RSI, MACD, or volume indicators may lead to poor trading decisions. We cannot just focus on the shape of the pattern and ignore other factors in technical analysis.
In 2020, Apple stock formed a rising wedge pattern. However, the strong growth in the global stock market made this pattern less accurate. If traders had relied solely on the rising wedge pattern without considering other macroeconomic factors, they might have missed significant profit opportunities from the stock’s uptrend. A specific example is when Apple stock surged in June 2020, and the divergence between price and trading volume was not correctly confirmed.
Accuracy Limitations: Not all wedge patterns behave the same way. In some cases, the pattern does not confirm the trend after price breaks through the trendlines, leading to a “fakeout” or “false breakout.” While the pattern can help identify potential entry points, without strong confirmation from other tools, traders may fall into traps of unprofitable trades.
A recent study from Investopedia showed that about 30% of wedge patterns may lead to fakeouts, especially in illiquid markets or during periods of strong volatility due to macroeconomic factors. For technical analysis traders, it is crucial to combine the wedge pattern with indicators like MACD and volume indicators.
Contrary Views on the Wedge Pattern
A contrary view should be noted, as many financial experts argue that the wedge pattern is not a reliable tool for long-term trading. While the pattern may be effective for short-term trading, it is not always trustworthy in strongly trending markets, where fundamental and macroeconomic factors heavily influence prices.
Tesla stock (TSLA) saw significant volatility throughout 2020 and 2021 and frequently formed wedge patterns. However, these patterns were broken shortly after, especially as the U.S. stock market continued its strong rally. If traders relied too much on the wedge pattern without considering fundamental factors like earnings, new products, or changes in the company’s strategy, they could miss important trading opportunities or suffer significant losses.
Things to Consider When Trading with the Wedge Pattern
An essential factor when trading with the wedge pattern is risk management. DLMvn has encountered many traders who overestimate the accuracy of this pattern, leading them to neglect setting proper stop-loss levels. This can result in substantial losses if there is a sudden shift in market direction.
Amazon stock in late 2018 and early 2019 serves as a good example. The rising wedge pattern warned of a potential reversal, but the failure to use additional confirmation tools and properly set stop-loss levels led some traders to get caught in price swings, resulting in unfortunate losses. Divergence indicators and signals from other tools like RSI could have helped avoid these mistakes.
“The most important lesson when trading with the wedge pattern is to always remember that no pattern is perfect. Sometimes, the combination of theory and reality can yield different results. Analyzing macroeconomic factors and combining them with other technical confirmation tools will increase your chances of success.” – DLMvn
Success Rate and Challenges of the Wedge Pattern
While the wedge pattern can help identify potential entry points, its success rate is not always high. According to a study by StockCharts.com, the average success rate of the wedge pattern is about 60-65%, meaning that in 3-4 trades, only 2 will likely produce favorable results. This requires traders to have a strict risk management strategy, as they will face significant risk when the pattern fails to perform.
Opportunities and Risks
The major opportunity of the wedge pattern is its ability to clearly identify entry points, but it also carries unpredictable risks. Factors like economic conditions, macro news, or changes in central bank policies can abruptly alter market trends, leading to false breakouts in the wedge pattern.
This was clearly evident in the case of the NASDAQ index in 2018, where wedge patterns were frequently broken during the U.S.-China trade negotiations. Even though rising wedge patterns appeared, the influence of macroeconomic factors weakened their accuracy.

DLMvn > Trading Indicators > Discover How to Trade Using the Wedge Pattern
Expand Your Knowledge in This Area
Trading Indicators
Exploring the Relationship Between Bollinger Bands and MACD
Trading Indicators
10 Candlestick Patterns Every Trader Should Know
Trading Indicators
Discovering Elliott Wave Theory: The Foundation of Market Forecasting Art
Trading Indicators
Triangle Patterns: The Most Common Patterns Appearing on Charts
Trading Indicators
Technical Analysis Indicators Groups: Understanding Their Differences and Applications
Trading Indicators
5 Variations of the Doji Star Candlestick Pattern