TABLE OF CONTENTS
- What Is a Bull Flag Pattern?
- How to Identify a Bull Flag Pattern
- Trading with the Bull Flag Pattern
- What Is a Bear Flag Pattern?
- How to Identify a Bear Flag Pattern
- Trading with the Bear Flag Pattern
- Advantages and Disadvantages of Trading with the Flag Pattern
- Contrasting Perspectives on the Flag Pattern
- Challenges of Trading the Flag Pattern
- Practical Examples in International Markets
The flag pattern is one of the familiar tools favored by many technical traders. Below, DLMvn will share how to identify and apply this pattern in real-world trading.
What Is a Bull Flag Pattern?
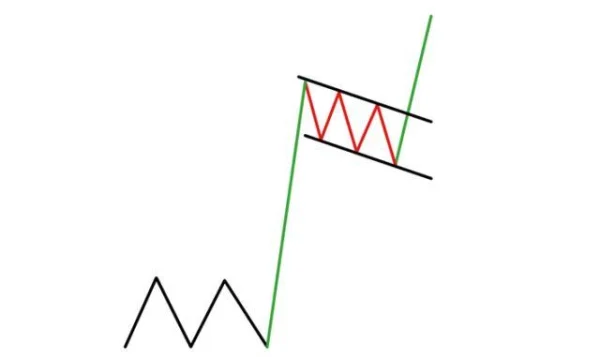
The bull flag typically appears after a strong upward trend, forming a downward-sloping channel or rectangle. The two parallel trendlines of this pattern are its most recognizable features. As a continuation pattern, the bull flag offers opportunities to trade in the direction of the current trend.
Trading volume is a crucial factor when identifying this pattern. During the flag formation, volume tends to decrease. When the price breaks out of the pattern, the volume significantly increases, strengthening the trading signal.

How to Identify a Bull Flag Pattern
- Identify the preceding strong uptrend (flagpole): This provides the momentum for the flag formation.
- Recognize the flag: This is the phase where the price moves sideways or slightly retraces within a narrow range.
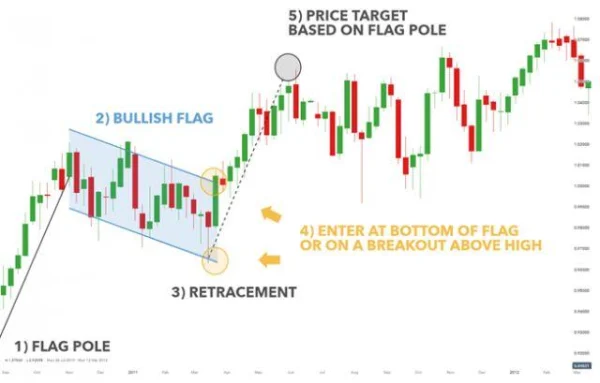
- Note the retracement level: If the retracement exceeds 50% of the flagpole’s length, the pattern may no longer be valid. The ideal retracement level is typically below 38%.
- Entry point: You can enter at the bottom of the flag or when the price breaks above the upper trendline.
- Price target: It is calculated based on the length of the flagpole, starting from the breakout point.
Trading with the Bull Flag Pattern
In the AUD/CAD chart above, the previous uptrend is represented by the black line. This is followed by a narrow price channel (the flag). Traders can choose between two strategies: entering at the lower edge of the channel to maximize profit or waiting for the price to break above the upper edge to confirm the trend. The price target is determined by the length of the flagpole, helping you develop an effective profit-taking plan.

What Is a Bear Flag Pattern?
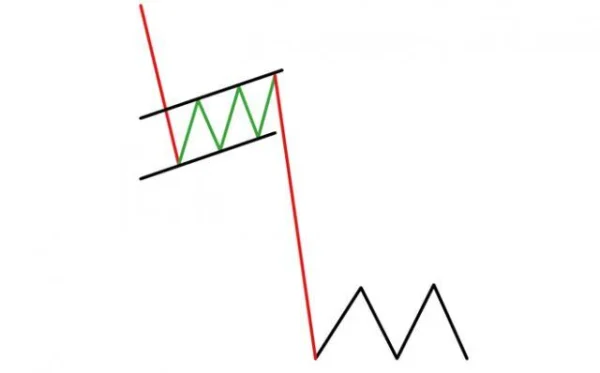
Unlike the bull flag, the bear flag appears in a downtrend, forming an upward-sloping channel or rectangle. This is also a continuation pattern, reflecting a temporary pause in the market before continuing to decline further.

How to Identify a Bear Flag Pattern
- Identify the preceding strong downtrend (flagpole): This provides the momentum for the flag.
- Recognize the flag: During this phase, the price slightly rises within a narrow range.
- Retracement level: If the retracement exceeds 50%, the pattern may no longer be valid. The ideal retracement level is usually below 38%.
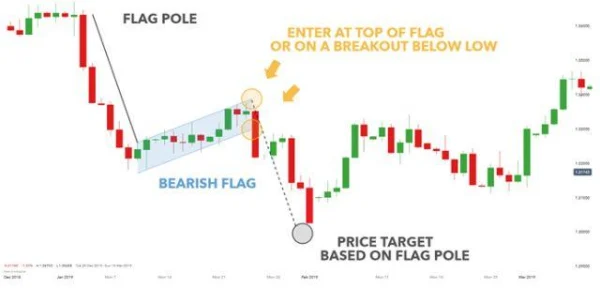
- Entry point: You can enter at the top of the flag or wait for the price to break below the lower trendline.
- Price target: It is calculated based on the length of the flagpole.
Trading with the Bear Flag Pattern
In the USD/CAD chart, the initial strong downtrend (flagpole) leads to the formation of the flag, represented by the blue channel. When the price breaks below the lower edge, the pattern is confirmed, and traders can use the flagpole’s length (470 pips) to predict the price target. The profit target is set at 1.3000, offering a reasonable risk/reward ratio.

Advantages and Disadvantages of Trading with the Flag Pattern
Advantages
- Flexible application across various financial instruments.
- Provides clear entry, stop-loss, and profit-taking points.
- Effective for tracking and leveraging market trends.
Disadvantages
- Challenging to identify for new traders, especially in noisy markets.
- Requires patience to wait for breakout signals to confirm.
In highly volatile markets, setting stop-loss levels must be done carefully to avoid being “stopped out” by minor fluctuations before the price moves in the desired direction.
Contrasting Perspectives on the Flag Pattern
Some seasoned investors argue that relying entirely on patterns like the flag can lead to errors in a constantly changing market. For instance, during the global economic recession in 2008, technical patterns such as bull and bear flags occasionally proved less reliable due to market instability.
A study by the Federal Reserve highlighted that during crisis periods, approximately 68% of continuation patterns (including flags) failed to meet expected price trends. This underscores the importance of considering fundamental factors and major economic news when applying these patterns.
However, in stable markets or blue-chip stocks like Apple (AAPL) or Microsoft (MSFT), the flag pattern remains useful, particularly when these companies report positive earnings, with their stock prices reflecting such news in the short term.
Challenges of Trading the Flag Pattern
-
Analysis Noise:
Small-cap stocks or stocks with low liquidity often generate false breakout signals. For example, during the significant volatility of GameStop (GME) in 2021, the flag pattern was broken multiple times before a definitive trend emerged, creating difficulties for traders relying solely on technical analysis. -
Market Sentiment:
Investor sentiment is a difficult variable to predict, especially during events such as earnings reports, central bank meetings, or CEO speeches. A notable case is Tesla (TSLA), where prices frequently broke technical patterns like flags immediately after unexpected statements from Elon Musk.
Practical Examples in International Markets
Bull Flag on Apple (AAPL) Stock
In 2020, when Apple announced a stock split plan, its stock price formed a bull flag on the daily chart. The flagpole was established with a 20% increase over 10 trading days, followed by a flag phase lasting approximately 5 days. After the breakout, the stock continued to rise by another 15% within a week.
Bear Flag on the S&P 500 Index
In March 2022, the S&P 500 index formed a bear flag after the Federal Reserve signaled an interest rate hike. The flagpole was defined by an 8% decline over two weeks, followed by a flag phase lasting an additional week. When the index broke below the lower edge of the pattern, the subsequent drop reached nearly 6%, matching the flagpole’s length.

DLMvn > Trading Indicators > Clearly Identifying the Flag Pattern in Trading
Expand Your Knowledge in This Area
Trading Indicators
Techniques for Using the Pennant Pattern in Stock Market Investing
GlossaryTrading Indicators
Stochastic Oscillator: An Effective Tool For Forecasting Market Trends
Trading Indicators
How to Identify and Trade Hammer Candlesticks on Charts
Trading Indicators
What Are Lagging Indicators? A Comprehensive Guide And Practical Applications
Trading Indicators
Essential Technical Indicators Every Trader Should Master
GlossaryTrading Indicators
Moving Averages – A Comprehensive Overview