TABLE OF CONTENTS
- Overview of the Doji Candlestick
- What Is a Doji Candlestick? And How Does It Work?
- Advantages of Using Doji Candlesticks in Technical Analysis
- Variations of the Doji Candlestick Pattern
- Applying the Doji Candlestick Pattern in Trading
- The Role of Doji Candlesticks in Market Sentiment Analysis
- Contrasting Opinions: Is the Doji a Reliable Predictor?
- Comparing the Effectiveness of Doji in Different Markets
- Doji Candlesticks in Historical Market Phases
- Tips for Effectively Using Doji Candlesticks in Trading
Overview of the Doji Candlestick
The Doji candlestick, often referred to as the Doji Star, is one of the most distinctive and easily recognizable patterns in the stock market. It represents indecision or hesitation between buyers and sellers. When neither side gains the upper hand, the opening and closing prices are almost identical, forming its characteristic cross shape.
While Doji candlesticks are primarily observed in trading, they also hold significant analytical value in major stock markets like the S&P 500 or Nikkei 225. Notably, there are five variations of the Doji pattern, each conveying unique messages, ranging from continuation signals to potential reversals. Understanding each type in depth will help you make more accurate trading decisions.
What Is a Doji Candlestick? And How Does It Work?
The Doji candlestick resembles a plus sign (+), with the opening and closing prices being nearly equal, while the upper and lower shadows may vary in length depending on market conditions. In stock markets, the appearance of a Doji often indicates a “pause” period where market participants reassess their strategies.
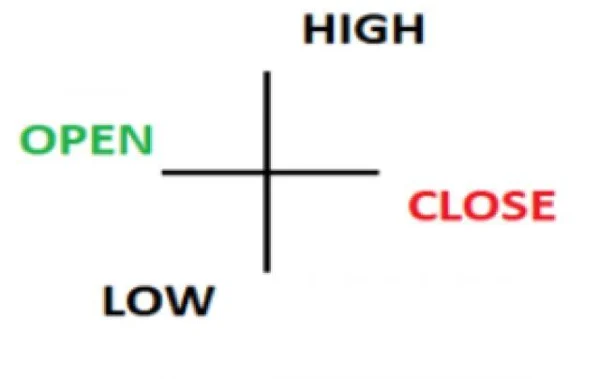
For example, during a strong uptrend in the Dow Jones index, the emergence of a Doji could signal increasing selling pressure or waning buying momentum. However, to confirm its significance, you should combine it with other technical indicators like RSI or MACD.
Advantages of Using Doji Candlesticks in Technical Analysis
Doji candlesticks are highly valuable for investors due to their ability to predict short-term trends. A Doji appearing in an uptrend may indicate the market is stalling, providing an opportunity to take profits before prices reverse.
However, DLMvn emphasizes that relying solely on a Doji candlestick for decision-making is unwise. A notable example is the “Black Monday” of 1987, when the S&P 500 plummeted by over 20% in a single day. A Doji appeared beforehand but was ignored, leading to significant losses for many investors.
Variations of the Doji Candlestick Pattern
1. Doji Star
This is the most basic and recognizable variation. The opening and closing prices are nearly identical, with relatively balanced upper and lower shadows. The Doji Star often appears when the market is uncertain about its next direction.
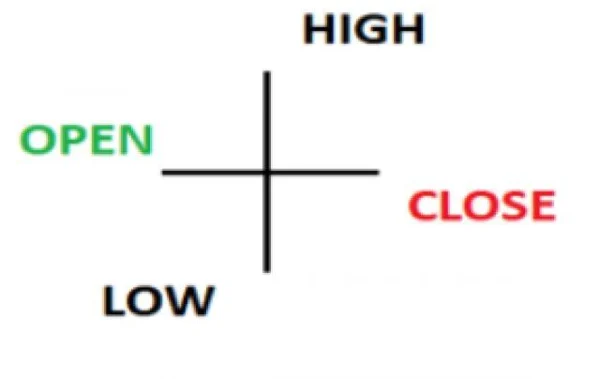
For instance, during the early stages of the Covid-19 pandemic, Doji Stars frequently appeared on the DAX (Germany) index chart, reflecting investor anxiety amidst significant volatility.
2. Long-Legged Doji
This variation features unusually long upper and lower shadows, indicating high levels of market instability. The Long-Legged Doji suggests that the market fluctuated significantly during the session, but neither side prevailed.
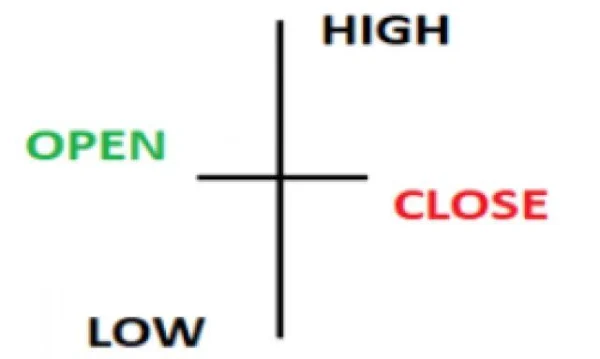
On Tesla’s chart in 2021, a Long-Legged Doji appeared just before the stock experienced a strong rally, signaling intense competition between buyers and sellers before the bulls took control.
3. Dragonfly Doji
This pattern has no upper shadow and features a long lower shadow. The opening, closing, and high prices are identical, indicating strong initial selling pressure that was overcome by buying forces.
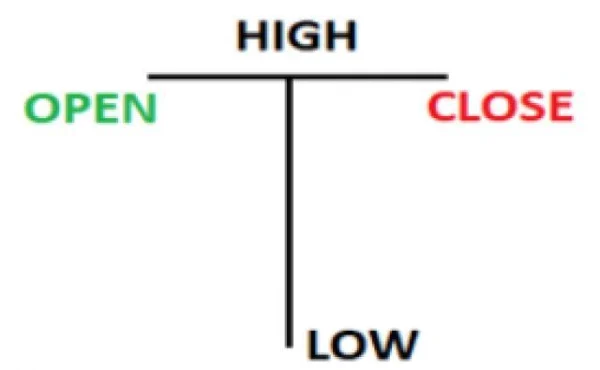
Dragonfly Doji often appears at the end of a downtrend, signaling a potential reversal. On Microsoft’s chart in 2022, this pattern emerged at a critical support level, leading to a prolonged price recovery over several weeks.
4. Gravestone Doji
In contrast to the Dragonfly Doji, the Gravestone Doji has no lower shadow and features a long upper shadow. The opening, closing, and low prices are nearly identical. This pattern typically appears at the top of an uptrend, warning of a potential bearish reversal.
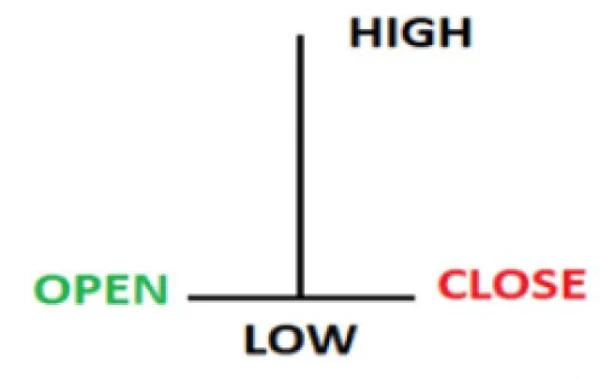
A notable example is Amazon’s stock in 2020, where a Gravestone Doji appeared right before a significant price drop following a prolonged rally.
5. The 4 Price Doji
This is the rarest variation, with the opening, closing, high, and low prices being identical, forming a short horizontal line. The 4 Price Doji represents a complete market “freeze,” with no price movement during the session.
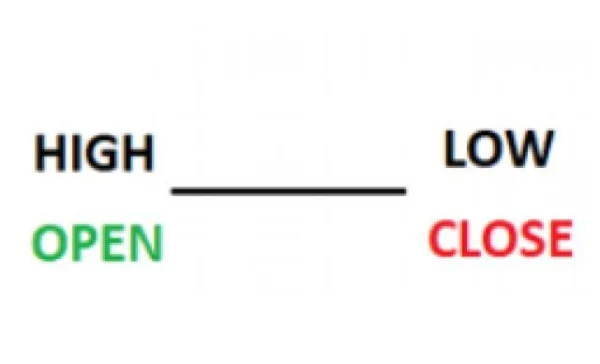
This pattern is often observed during low-liquidity periods, such as holidays or after-hours trading sessions.
Applying the Doji Candlestick Pattern in Trading
1. Trading with the Doji Star
The GBP/USD chart illustrates how a Doji Star appears at the end of a downtrend, signaling a potential reversal. However, confirmation is essential. Using the Stochastic indicator showed the market was in oversold territory, reinforcing the prediction of an upward trend.
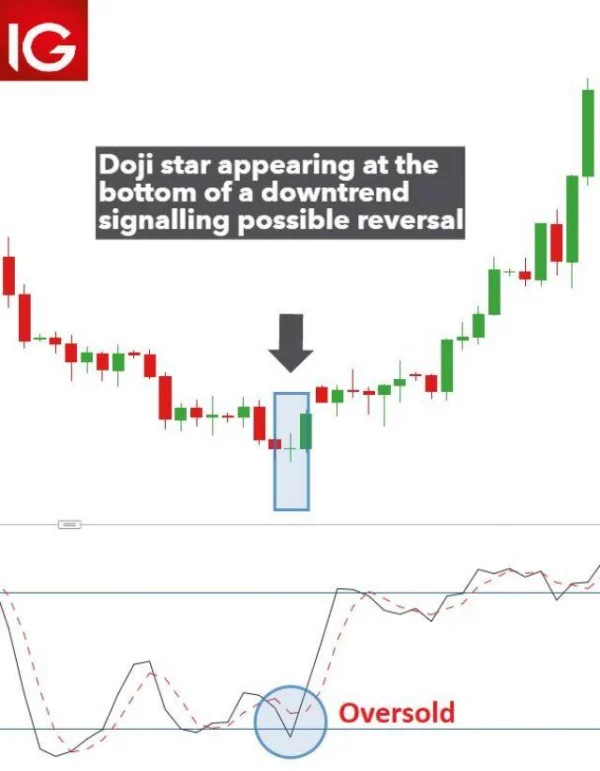
2. Using Dragonfly Doji in Trend Trading
The Dragonfly Doji provides strong signals when it appears near support zones. On Apple’s chart, when the price touched a trendline support and a Dragonfly Doji appeared, the uptrend was confirmed by a sharp increase in trading volume.
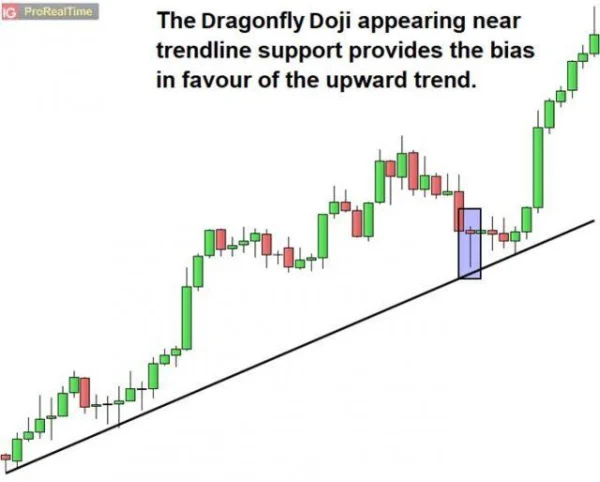
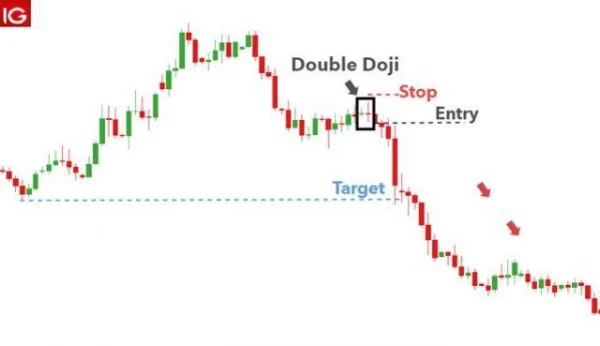
3. Double Doji Trading Strategy
Two consecutive Doji candlesticks (Double Doji) indicate prolonged indecision between buyers and sellers. On the GBP/ZAR chart, the Double Doji signaled a strong breakout, offering traders an opportunity to capitalize on the newly formed trend.
When trading with Doji candlesticks, always use tight stop-loss orders and set specific price targets. This approach protects your capital and maximizes profits, especially in volatile markets like Nasdaq or FTSE 100.
The Role of Doji Candlesticks in Market Sentiment Analysis
Doji candlesticks are not merely technical chart patterns; they also reflect the collective psychology of the market during periods of indecision. Especially in major markets like the S&P 500 or Nikkei 225, the appearance of a Doji often coincides with critical moments when investors deliberate between continuing a trend or adjusting their portfolios.
A prime example occurred in March 2020, as the global COVID-19 pandemic heavily impacted financial markets. Numerous Doji candlesticks appeared on major indices like the FTSE 100 and Dow Jones, signaling investor hesitation about the severity of the crisis before markets plunged later in the month. This highlights that a Doji does not always lead to an immediate reversal but can serve as a precursor to significant price movements.
Contrasting Opinions: Is the Doji a Reliable Predictor?
While the Doji candlestick is often regarded as a strong signal in technical analysis, its effectiveness is debated. Some financial experts argue that a Doji is only reliable when accompanied by other factors, such as high trading volume, strong support/resistance levels, or confirmations from technical indicators.
For instance, during Tesla’s stock rally in late 2020, Doji candlesticks frequently appeared at price peaks but did not result in immediate reversals. Instead, the price continued to climb, leading to losses for traders who hastily sold. This raises the question of whether relying solely on Doji patterns without considering additional factors is a viable trading strategy.
Comparing the Effectiveness of Doji in Different Markets
The effectiveness of Doji candlesticks varies across different markets. In equity markets, where prices are often influenced by fundamentals like earnings reports or news, Doji patterns tend to appear at pivotal moments. Conversely, in commodities markets like gold or crude oil—where investor sentiment is frequently driven by external factors such as political events—Doji candlesticks tend to be more random.
For example, in August 2021, Brent crude oil prices fluctuated and formed Doji patterns on daily charts. However, due to influences like the Middle Eastern supply crisis and pressure from OPEC, the signals from these Doji patterns did not result in clear trends. This demonstrates that in complex markets, Doji signals must be validated with other factors.
Doji Candlesticks in Historical Market Phases
Doji candlesticks have appeared during several critical historical phases in financial markets. A notable example is the 2008 financial crisis when Doji patterns frequently emerged on the S&P 500 chart as the market swung sharply between hopes of recovery and fears of collapse. These Doji candlesticks clearly reflected investor uncertainty and served as early warnings for the significant volatility that followed.
Tips for Effectively Using Doji Candlesticks in Trading
-
Consider Accompanying Trading Volume
High trading volume accompanying a Doji candlestick often strengthens its signal, indicating active participation from both buyers and sellers. In the U.S. stock market, when trading volume exceeds the 20-day average, Doji signals tend to be more reliable. -
Combine with Other Candlestick Patterns
Doji candlesticks become more dependable when they appear as part of larger patterns, such as Morning Star or Evening Star formations. For instance, on Amazon’s chart, a Doji within a Morning Star pattern accurately predicted a strong upward reversal in early 2021. -
Identify Support and Resistance Zones
A Doji candlestick appearing at strong support or resistance levels is generally more reliable than one appearing randomly. For example, when a Dragonfly Doji formed at a robust support zone on the Nasdaq index in November 2022, the index surged over 7% in the following two weeks.

DLMvn > Trading Indicators > 5 Variations of the Doji Star Candlestick Pattern
Tagged Articles
Profiting from the Morning Doji Star Candlestick Pattern
An Introduction to the 5 Doji Candle Patterns
Expand Your Knowledge in This Area
Trading Indicators
Analysis and Trading with the Cup and Handle Pattern
Trading Indicators
Pivot Points: How to Identify Support and Resistance Levels
Trading Indicators
Trading with Bollinger Bandwidth: Identifying Accurate Entry Points
Trading Indicators
Trade Smarter with Long Wick Candles
Trading Indicators
What is the Shooting Star Candlestick Pattern? Meaning and How to Identify It
Trading Indicators
Discover How to Combine Moving Averages with Candlestick Patterns Effectively